
Chapter 13
OFFENSIVE SEARCH
Previous chapters have discussed problems involved in the defense of ships and convoys and in attacks on submarines by surface craft and aircraft.
To some extent these attacks may be made on submarines contacted during escort of convoy operations, but these operations are not the only source of
contacts. Normally, offensive operations are also undertaken for the specific purpose of contacting and attacking submarines in order to inflict a high
loss rate on the enemy submarine fleet. While the overall aim of all antisubmarine operations is a negative one-to prevent the submarines from accomplishing
their objective-this aim can be achieved by both defensive and offensive means. Convoy escort is clearly defensive, but once convoy escorts make a contact,
an effort is made to attack and sink the sub, that is, to take the offensive. Sinking the submarine is valuable in a direct defensive way in that it is then
certainly prevented from attacking the convoy, but a sinking is also valuable offensively in that the submarine is thereby eliminated from all future
operations. The clearly offensive phase of antisubmarine activity takes the form of searching for submarines and attacking them even when they do not
immediately threaten any friendly ships. The distinction is not absolutely hard and fast, since any submarine is a potential threat. Defensive measures
arc intended to find and attack submarines that may be dangerous within the next few minutes or hours, offensive measures, those dangerous at more remote
time.
Methods for attacking submarines are the same whether the intent is offensive or defensive, but the methods involved in searching for a submarine
depend on the aim of the operation. In particular, defensive operations are carried out fairly close to the ships being defended, whereas offensive
operations are concentrated in the regions containing the most subs, other things being equal. This chapter will outline some of the considerations
involved in conducting offensive searches. Three general types of situation are involved.
- Search of an area in which one or more submarines are thought to be patrolling.
- Interception of submarines in transit whose paths are thought to pass through a certain region.
- Follow-up of contacts made some time previously and then lost, for the purpose of finding the submarine again.
These problems have been discussed in general terms in Volume 2B, Search and Screening, Chapters 3, 7, and 8, but not with special reference to
searching for submarines. In these chapters detailed methods are described for designing searches in a great variety of tactical situations, and the
basic theory of search is developed, which applies to search for submarines as a special case. Consequently the following discussion is, in a sense,
a review of material presented in Search and Screening, with emphasis on the antisubmarine applications and operational data reflecting experience in
antisubmarine warfare [ASW].
When available intelligence indicates32 that submarines are on patrol in a certain region, search for them will be productive of contacts in
proportion to the density of submarines and to the area which can be covered by the searching craft. The general considerations of Chapter 3 of
Search and Screening apply, assuming the available intelligence to be expressed as a probability density function. For a given function ps(x,y),
the chances of success are determined by the search rate and the amount of searching effort available. In order to have an effective search the
searching craft must either be many in number or have a large sweep rate.
| 13.1.1 |
Aircraft Search for Surfaced Submarines |
Aircraft are outstanding for having a large sweep rate because of their high speed and distant visual horizon.33 They are normally restricted
to visual and radar detection, however, and are thus effective only
--139--
against surfaced (or Schnorcheling) submarines.34 Consequently the density which must be used in studies of aircraft search is the density of surfaced
submarines, and a region in which there are many submarines all of which are submerged is not profitable for search by aircraft.
As an example of the influence of the submarine's submergence tactics, the offshore gain effect can be used to illustrate the significance of sweep rates.
It was common experience that aircraft patrol was relatively most effective when carried out at a considerable distance from shore bases, since submarines
close to them were cautious and spent a large fraction of the time submerged. As an example of the phenomenon, data based on Moroccan Sea Frontier flying are
of interest.
The region tinder study was divided into zones 200 miles wide, that is: 0-200 miles from land, 200-400 miles, 400-600 miles, and 600-800 miles. The number
of actual aircraft contacts in each zone was counted, and an expected number computed, which was based on the number of flying hours in each zone, the total
density of U-boats in the zone, and an assumed 5-mile sweep width. In this way the figures of Table 1 were derived.
TABLE 1. Contacts in Moroccan sea frontier antisubmarine patrols.
Distance from base
(miles) |
0-200 |
200-400 |
400-600 |
600-800 |
Total |
| Expected No. contacts |
83 |
58 |
30 |
20 |
191 |
| Actual No. contacts |
5 |
5 |
10 |
6 |
26 |
| Per cent realized |
6 |
9 |
33 |
30 |
14 |
| Effective sweep width (miles) |
0.3 |
0.5 |
1.6 |
1.5 |
0.7 |
The effective sweep width is the value of sweep width that would have to be used in computations to have the expected number of contacts equal to the
number actually obtained. The increase in effective sweep width or "per cent realized" as distance from shore bases is increased is probably due to a
relaxation of precautions by the U-boats. Whatever its cause, however, it is evidence of the desirability of flying at considerable distance from shore
bases when on offensive patrol.
The use of radar to increase the sweep width beyond that achievable by visual means is of great importance in area search (or in any other type). Early
radars did not have a detection range sufficiently great to exceed that of visual detection except in periods of darkness or low visibility, but the newer
types are powerful enough to do so a large part of the time. The older radar was valuable chiefly because it made contacts in periods of low visibility when
U-boats were surfaced. Data on Army Air Forces Anti-Submarine Command flying in Eastern Sea Frontier for May through October 1942 and in the Trinidad area
for October and November both bear this out, as is shown in Table 2. In these cases use of radar during the daytime did not do very much to reduce the number
of flying hours required to secure a contact, but radar used at night was many times more effective than in daytime. The chief explanation is, no doubt, that
U-boats were submerged in these regions during the daytime and good opportunities for contacting them were offered only at night.
TABLE 2. Radar versus visual search during 1942 (in terms of hours per contact).
| |
Visual
only |
Radar
during day |
Radar
during night |
| ESF May-Oct |
| Hours of flying |
21,108 |
4,665 |
1,125 |
| No. of contacts |
32 |
10 |
7 |
| Hours per contact |
660 |
466 |
161 |
| Trinidad Oct-Nov |
| Hours of flying |
1,400 |
2,400 |
430 |
| No. of contacts |
3 |
4 |
9 |
| Hours per contact |
470 |
600 |
50 |
Patrol height is also of importance in achieving the maximum sweep rate. For both visual and radar search the altitude must be sufficiently high to give
a distant horizon, and for visual search the increased apparent area of the wake is also of importance, as explained in Chapter 4 of Volume 2. The theoretical
TABLE 3. Sweep widths for aircraft visual search.
(Surfaced submarine under way.)
| Altitude (feet) |
Visibility 3 miles |
Visibility 15 miles |
| 500 |
3.0 |
8 |
| 1,000 |
3.5 |
10 |
| 2,000 |
3.5 |
11 |
| 5,000 |
--- |
12 |
| 10,000 |
--- |
14 |
--140--
table of sweep rates presented in Table 3 shows clearly the advantages of high altitude for visual search.
As an example of operational data confirming the value of flying at fair height, data on sightings in the Bay of Biscay area during May 1943 can be
quoted. Table 4 gives the sightings per 100 sorties. As would be expected, altitudes over 2000 ft give only a slight gain when meteorological visibility
is low but have considerable advantage under good visibility conditions.
The question may well be raised, however, whether the high altitude is not a handicap in delivering an attack. The aircraft must lose altitude to make
a low-level bombing run, which would sometimes slow up the approach. The overall results shown in Table 5 do not, however, indicate any significant effect
of this sort. It is probable that U-boat lookouts have tended to scan the horizon in search for aircraft so that the higher-flying aircraft have somewhat
of an advantage in approaching undetected. In any event the overall gain of altitude above 2000 ft is clear.
TABLE 4. Sightings per 100 sorties for different patrol heights.
| Height of Patrol |
Meteorological visibility |
| 0-4 miles |
5-12 miles |
over 12 miles |
| 0-2,000 ft |
6.2 |
14 |
22 |
| over 2,000 ft |
7.9 |
26 |
37 |
TABLE 5. Effect of altitude on success of attacks.
Height
of Patrol
(feet) |
Percentage of Class A attacks
(Coastal Command Data, June-Nov 1943) |
Per cent of attacks causing damage
(U.S. Strategic Area, July-Dec 1942) |
Total No.
sighting |
No. of
Class A |
Per cent
Class A |
Total No.
attacks |
No. assessed
A-D |
Per cent
A-D |
| 0-2,000 ft |
96 |
44 |
46 |
91 |
10 |
11 |
| 2,000-4,000 ft |
86 |
34 |
40 |
36 |
3 |
8 |
| Over 4,000 ft |
38 |
18 |
41 |
32 |
3 |
9 |
There are many other questions relating to the most effective conduct of visual or radar search of a submarine patrol area by aircraft. The general
problem involved is to achieve the best possible sweep width and then lay out a patrol where surfaced submarines are densest in accordance with Chapters
3 and 7 of Volume 2B, Search and Screening.
The advent of Schnorchel drastically reduced the aircraft's search capabilities because both radar and visual sweep width on Schnorchel are much less
than on surfaced U-boats-according to most estimates only 1/10 to 1/100 as great. To a slight extent this reduction is compensated by the Schnorcheling
U-boat's need to operate in restricted focal areas, the area to be searched by either aircraft or surface craft being thus much reduced. A net result has
been a marked increase in the importance of surface craft search compared with that by aircraft for submarines operating on Schnorchel.
To some extent however, aircraft can conduct a sonar search by use of sono-buoys. If the submarine is proceeding at high speed on Schnorchel and
is therefore noisy, the effective sweep rate of a group of sonobuoys monitored by an aircraft may be comparable to that of surface craft using sonar.
| 13.1.2 |
Surface Craft Search Submerged Submarines |
The role of surface craft in searching an area is limited by their small sweep rate. Visual and radar detection ranges are shorter than for aircraft,
and the speed of the ship very much less. Table 6 presents a
TABLE 6. Sweep rates under various conditions (in sq miles per hour).
| |
Surfaced sub |
Submerged sub |
| Aircraft |
| Visual (good visibility) |
1,250 |
Approx 0 |
| Radar - ASG |
2,500 |
Approx 0 |
| MAD |
25* |
15-20* |
| Sono-buoys |
200* |
15* |
| Surface craft |
| Visual |
Approx 0 |
Approx 0 |
| Radar |
100 |
Approx 0 |
| Sonar |
15 |
15 |
* Estimated on the basis of tests but not confirmed by operational data.
--141--
comparison of typical aircraft and surface craft sweep rates. Visual search by surface craft is not likely to be effective since the submarine can
almost invariably see the surface craft in time to dive before the surface craft sees it. This visual search has purely hold-down value and is not
effective in an offensive sense. Radar search by surface craft under low visibility conditions may, on the other hand, be expected to lead to contacts
on any surfaced submarines unless they are fitted with search receivers and dive upon being approached. For surfaced submarines, however, the surface
craft have a considerably smaller sweep rate than aircraft, so that the chief role of surface craft is conducting searches for submerged subs, a task
for which aircraft are not effective.
The sweep rates for aircraft using magnetic anomaly detectors [MAD] or sono-buoys in hunting submerged submarines are about the same as that for surface
craft using sonar, according to Table 6. The comparison is not a completely fair one, however. In the first place, the aircraft figures are based on trial
results and have not been completely substantiated by operational data. Operational experience has indicated that classification of MAD and sono-buoy contacts
is particularly difficult. In the second place, neither of them gives an accurate determination of the submarine's position but only a general indication of
its presence, and it is difficult to make an effective attack on contacts of this type.
The primary task of surface craft in area search is thus sonar search for submerged submarines. Such search can be effective only if the submarines are
concentrated in a small area, since the surface craft sweep rate is so small. To search an area 100 miles square with five ships requires about 6 days,
whereas a single aircraft can search the same area for surfaced subs in 4 hours. Accordingly there are relatively few circumstances in which surface craft
can be employed profitably for area search.
To some extent high-frequency direction-finding [DF] extends the search capabilities of surface craft, since it enables the ship to take a bearing on
a submarine transmitting on high frequency within about 20 or 30 miles. If the submarines transmit frequently, as German U-boats did during the height of
the Battle of the Atlantic, DF can increase the radar sweep rate by a factor of up to 3 or 4 for surfaced subs. A DF contact is not quite so valuable as a
radar contact, however, because it is less definitely localized and more difficult to convert into an attack.
Fundamentally, then, surface craft search of an area is a matter of sonar search. World War II has not offered very many opportunities for such search,
surface craft having been put to effective use mainly in follow-up of contacts and in defensive operations, and consequently little in the way of operational
data is available.
One tactical principle should be emphasized, however, that of searching in groups in line abreast. The theoretical reason for doing this is that a submarine
has a good chance of evading a single ship by steering to one side at high speed when the approach of the ship is detected. Figure 1 shows the effect of such
evasion.
 |
FIGURE 1. Submarine evasion of sonar search. |
The "entrapment triangle" is drawn tangent to the sonar detection circle with limiting escape lines drawn at angle = sin-1 sub speed/ship speed. In
this way it is analogous to the submerged approach zone except that the submarine is trying to get out rather than in. As can be seen from Figure 1
searching in line abreast makes such evasion impossible except from positions near the ends of the line. Some theoretical considerations concerning search
in line abreast arc given in Chapter 6, Volume 2B.
There are also many practical reasons for searching in line abreast. The ships are close enough for convenient communications and know the positions of
their fellow ships at all times. Similarly the ships' are readily recognizable by aircraft or other forces in the area, even at night. In addition ships are
in a position
--142--
to coordinate during attack once a contact is made.
It is, in fact, almost always valuable to carry out offensive operations in groups. If a group of units is sent out at once on parallel sweeps
(or to patrol the same area according to some fixed plan), any unit making contact has immediate assistance available (provided communications are
satisfactory), and all the other units can, if desired, enter into the process of attacking or following up the contact. In this way the chances of
sinking the submarine, once contact is made, are very materially increased over what they would be with a single attacking unit. As a balance to this
gain is the necessary loss in probability of making contact which results from concentrating too much of the searching effort into a particular area or
period of time to the exclusion of some others. These two considerations must be weighed and the best compromise achieved. When the area to be searched
is rather large, however, as is usually the case, a search by a group of units covers it only very incompletely and there is no difficulty with
"over-searching." In such a case offensive patrol in groups spaced as closely as possible without overlapping of the areas searched by individual
units is clearly desirable. Groups may involve aircraft or surface craft, or both. The basic idea is simply to provide for coordinated attack upon
any contact that is made without appreciable loss in efficiency of distribution of search effort.
| 13.2 |
INTERCEPTION OF TRANSITS |
In many cases it is profitable to endeavor to intercept submarines en route to their patrol area and attack them before they are able to become
dangerous. Submarines in transit may be thought of as making up a moving density distribution (as opposed to a stationary one for those on patrol).
This comparison is discussed in detail in Chapter 7 of Volume 2B and the appropriate modifications in search plans are described. As a result of this
movement, the crossover type of barrier patrol is usually the most efficient, as was pointed out in Volume 2B.
This movement does not, in itself, make detection of the submarines involved any easier, but often results in a more accurate estimate of the
submarine's position than is possible with a submarine on patrol. This may be very strikingly true if the submarines are constrained to pass through
a relatively narrow region while on passage to the patrol area. In such a case the submarine density is much higher in the transit area than the patrol
area and consequently the former is the better area for exploitation by an antisubmarine offensive, other things being equal.
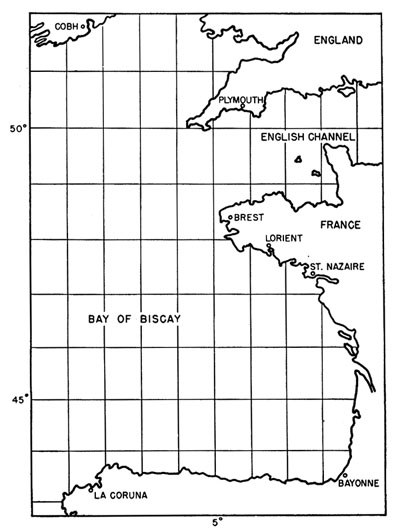 |
FIGURE 2. Bay of Biscay. |
| 13.2.1 |
The Bay of Biscay Offensive |
The outstanding transit area of this type has been the Bay of Biscay off the U-boats' French ports of Brest, Lorient, St. Nazaire, and La Pallice.
All U-boats entering or leaving these ports had to funnel through the Bay within reach of British-based air cover, so that excellent opportunities for
attacking U-boats were presented. (See Figure 2.)
An analysis of the possibilities of an offensive in the Bay was made late in 1942,35 some of whose salient arguments are discussed here. The basic idea
was that the U-boats had to spend a fair amount of time on the surface crossing the Bay and that therefore a "balanced" force capable of carrying out
effective search both day and night would be able to intercept
--143--
a large fraction of the U-boats and inflict very serious losses. (Schnorchel was not to appear until long after this time.) By adopting maximum
submergence tactics, the U-boat could reduce its time on the surface during any given day very greatly, but a greater number of days was required to
cross the Bay because of the slower speed involved, and the entire passage could not be made submerged. The net gain by submerging is shown in Table 7,
assuming a 300-mile band covered by aircraft across which the U-boats must pass. Thus the U-boat must spend about 13 hr on the surface in crossing the
Bay even when using maximum submergence.
TABLE 7. Surfaced days per transit.
Fraction of
time spent
on surface
(per cent) |
Speed on
surface
(kt) |
Speed
submerged
(kt) |
Average
speed
(kt) |
Total
time
(hours) |
Time
on surface
(hours) |
| 100 |
10 |
--- |
10.0 |
30 |
30 |
| 50 |
10 |
4.5 |
7.2 |
42 |
21 |
| 20 |
10 |
2.8 |
4.2 |
71 |
14 |
| 10 |
10 |
1.5 |
2.4 |
125 |
13 |
| 100 |
17 |
--- |
17.0 |
18 |
18 |
If the total number of transits per month is designated by r, then the average number of surfaced U-boats in the area is (there being approximately
720 hr per month):
 |
Equation (1) |
The expected number of contacts is
 |
Equation (2) |
| where |
Q = aircraft sweep rate, |
| h = number of flying hours per month, |
| A = area involved. |
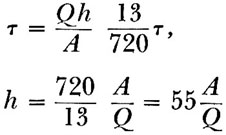
In order to contact every transit U-boat once, for example, it would be necessary to have N = r, which condition can be used with equations (1)
and (2) to determine the number of flying hours required.
 |
Equation (3) |
The area involved is about 300 miles square so that the hours required are as given by Table 8.
TABLE 8. Flying requirements to sight each transit.
Type detection
gear |
Sweep rate Q
sq miles per hour |
Flying hours
per month
required |
| Meter-wave |
800 |
6,000 |
| Centimeter |
2,800 |
1,800 |
These figures for flying hours per month can readily be interpreted in terms of the number of planes required. A long-range plane is normally capable of
flying about 50 hr per month, so that a force of about 40 such planes equipped with centimeter radar would be adequate to contact each U-boat crossing the
Bay. (The flying required to get back and forth from base to the active Bay area would not increase this figure greatly.)
The comparison of actual results obtained in the operations with these predictions is of particular interest. Since the situation changed rapidly from
time to time the data presented in Table 9 are given by months and divided into three periods corresponding to various stages of the battle. Average values
are given for each period. At the end of the third period the number of transits dropped off sharply and U-boat activity did not again reach the previous level.
TABLE 9. Results of Bay of Biscay offensive.
| Month |
Flying
hours
on patrol |
U-boat
transits |
Sightings
of U-boats |
Per cent
sighted |
First period |
| June 1942 |
2,600 |
50 |
26 |
52 |
| July |
3,750 |
65 |
20 |
31 |
| Aug |
3,200 |
80 |
37 |
46 |
| Sept |
4,100 |
90 |
39 |
43 |
| Average |
3,400 |
71 |
30 |
43 |
Second period |
| Oct 1942 |
4,100 |
95 |
18 |
19 |
| Nov |
4,600 |
140 |
19 |
14 |
| Dec |
3,400 |
130 |
14 |
11 |
| Jan 1943 |
3,130 |
105 |
10 |
10 |
| Average |
3,800 |
117 |
15 |
13 |
Third period |
| Feb 1943 |
4,400 |
100 |
32 |
32 |
| Mar |
4,600 |
135 |
42 |
31 |
| Apr |
4,200 |
115 |
52 |
45 |
| May |
5,350 |
120 |
98 |
81 |
| June |
5,900 |
57 |
60 |
105 |
| July |
8,700 |
78 |
81 |
104 |
| Average |
5,500 |
101 |
61 |
60 |
--144--
The first period involves night flying by Wellingtons equipped with Leigh Lights and meter-wave radar. Only about 10 aircraft were so equipped,
but the overall result was to sight almost half the transits. Since the number of flying hours per month was only slightly more than half that quoted
in Table 8 for meter-wave radar, this result is not far removed from that predicted. Actually the predicted average number of
sightings would be 40, the operational results 30-a pretty close agreement.
During the following months, however, the fraction of transits sighted declined markedly, reaching a low of 10 per cent. To some extent this may have
been a seasonal effect because of the difficulties of flying in winter, but the chief reason for the drop was undoubtedly the introduction of search
receivers on U-boats which could detect meter-wave radar. This development permitted the U-boats to surface at night with fair safety, and the aircraft
available no longer constituted a balanced force. (See Chapter 14 for further discussion.)
During the spring of 1943 the Leigh Light Wellingtons were equipped with centimeter radar and results during the third period were correspondingly
improved. By June and July the fraction of transits sighted had risen to 100 per cent, a tenfold increase, though the number of flying hours in those
months was only about twice what it had been in previous periods. If all the planes had been fitted with centimeter radar, an even higher sighting rate
would have been expected on the basis of Table 8, since there was considerably more flying than the 1800 hours per month which should produce 100 per
cent sightings. Such was not the case, however, and the average sweep rate of all planes involved was probably more nearly that of meter radar. On this
basis 6000 hr per month would be required to produce 100 per cent sightings, which is in good agreement with the observed results. The average amount of
flying was 5500 hours per month, which sighted 60 per cent of the transits, reaching a peak of 100 per cent during the best summer months.
It may be concluded, then, that the best periods of the Bay operations provided returns quite in accordance with predictions, but that the U-boats
were quick to find and exploit any weak points in the offensive. The highly profitable periods were not of long duration. Even during the low points,
however, Biscay operations were quite profitable compared with aircraft patrol in other regions, since the flying
hours required to make a sighting rarely rose above 500, whereas in many areas thousands of hours were required.
| 13.2.2 |
Value of Interception of Transit Submarines |
The final evaluation of any offensive against transit U-boats must be made on the basis of a comparison with other possible uses of the forces
involved. When the other use contemplated is also some type of offensive patrol, the chief criterion is that of submarine density (or density of
surfaced subs if more appropriate), as is demonstrated in Volume 2B, Chapter 3. Offensive patrol should be carried out in the region of greatest
submarine density, subject to certain practical considerations. A region in which weather conditions reduce the effectiveness of detection gear by
a factor of three, for instance, would not be a profitable one for an offensive unless the submarine density there was at least three times that in
other regions.
When the comparison must be made between offensive and defensive operations, many more factors must be considered. The usual objective measure of
the effectiveness of antisubmarine operations is the number of ships saved. Defensive operations effect such a saving quite directly, whereas offensive
operations have an indirect effect through reduction ill numbers of submarines operating and through lowering of the morale and state of training of the
submarine crews. The latter effect is very hard to assess in any numerical terms. U-boats have usually withdrawn from areas in which their chance of being
sunk was greater than about 10 per cent per month of those at sea when there was a safer alternative, but the high sinking rate has often been associated
with a low rate of sinking ships, so that the U-boats may have withdrawn in search of more profitable areas, rather than because of any effect on morale.
Nevertheless, the U-boats' heavy losses in 1943 were followed by a period of very unaggressive operations, even though the losses suffered were not enough
seriously to diminish the size of the U-boat fleet, and there is no doubt that a lowering of morale and experience of crews had something to do with it.
In order to illustrate the type of comparison that must be made, consider a hypothetical situation in which the enemy has a hundred submarines which can
spend half their time at sea. He can build five
--145--
per month, but we sink the same number by surface craft (i.e., 10 per cent of those at sea each month), so that a sort of equilibrium has been reached.
Given, then, a force composed of 40 aircraft, should they be employed either offensively, assuming that each submarine transit would then be sighted in
accordance with equations (1) to (3), or defensively for escort of threatened convoys, assuming that the
protection offered would be in accordance with the data of Chapter 10?
In each case the number of ships saved by the aircraft must be determined. For the offensive operations the saving can be estimated in the following way:
The immediate effect of the offensive operation is an increased number of submarines sunk per month. This will reduce the number of submarines operating
until, in the long run, a new equilibrium is reached. The number of submarines sunk per month will then be equal to the number built. If N is the number of
submarines available to the enemy, and T is the length of a submarine patrol in months, then:
N = number of submarines at sea, and
N/T = number of transits made per month.
The capabilities of the surface craft are assumed to be such that they sink 10 per cent of the subs at sea per month, and data from Chapter 12 show that it is reasonable to assume that about 10 per cent of all aircraft sightings lead to attacks which sink the submarine.
Combining these figures with the ability of the aircraft to intercept each transit, we have, at equilibrium:
 |
Equation (4) |
The normal length cruise for a U-boat has been about 2 months. Using this value for T we have N = 50 submarines, which is only half the force that was
available in the absence of the aircraft offensive. Thus we would expect this offensive use of aircraft to cut the losses of merchant ships in half.
This figure can be compared with the direct defensive value in escort of threatened convoys. The experience quoted in Chapter 10 was that four sorties per day decreased the daily losses by about 65 percent. If the aircraft force available could
provide this extent of convoy coverage, it would be considerably more valuable than when employed offensively, because the 65 per cent figure measures
only direct defensive value and does not take into account any attacks on submarines that the planes might make while on convoy escort duty. The total
amount of aircraft flying required for the convoy escort would not generally be excessive. During the actual period studied previously there were about
20 convoy-days per month in the "threatened" class, so that only 80 sorties per month would be needed, whereas the aircraft could be expected to fly about
200 sorties monthly. Some threatened convoys may, however, be in positions which cannot readily be covered by aircraft, so that the expected thoroughness
of coverage must be estimated on the basis of weather, distance of convoy routes from bases, and similar factors. In the North Atlantic, convoys were, in
fact, covered on somewhat less than half the days when they were threatened. If this sort of restriction must be accepted, the expected reduction in losses
is only about 30 per cent, which is no longer obviously superior to the offensive employment of aircraft in the transit area. As a matter of fact the
sightings made (about 15 per month) were about enough to make up the discrepancy between 30 per cent and 50 per cent saving.
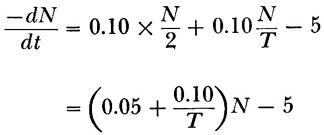
Such a comparison is never strictly valid, however, because it is made on the basis of an equilibrium condition which is not approached very quickly.
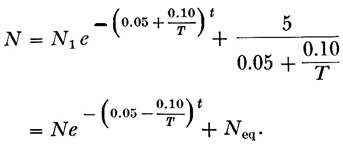
If we consider N to be a function of time, then equation (4) is replaced by:
 |
Equation (5) |
 |
Equation (6) |
Here Neq is the equilibrium number of submarines. For the case previously considered, T = 2 months, the number of submarines is plotted in
Figure 3.
Thus the value of an offensive operation depends
--146--
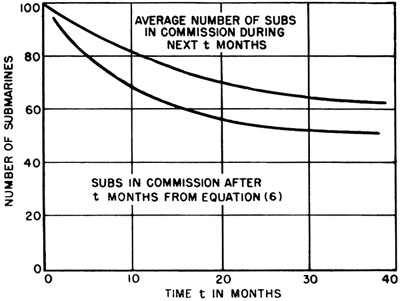 |
FIGURE 3. Diminution of submarine fleet by an antisubmarine offensive. |
on the expected length of the war, the upper curve giving the reduction in the average number of submarines operating as a function of the length
of period under consideration. If the war is expected to last another 30 or more months, the offensive will achieve very nearly its equilibrium effectiveness
in that the number of submarines operating is reduced by about 40 per cent with the lifetime (and consequently experience of ships and crews are correspondingly
reduced). If, on the other hand, the war is to last only 6 months, the average reduction in submarines operating is only about 10 per cent.
The comparison between defensive and offensive measures is made explicitly in Figure 4. The ordinate is proportional to the reduction in ship losses,
with no account taken of the attacks on U-boats-made by escort aircraft. It is clear that the effect of the length of the war on the value of an
antisubmarine offensive and the effect of the probable completeness of convoy escort must be taken into account in arriving at an evaluation of the
relative merits of the two possible uses of the aircraft. It is clear also that no general conclusion can be made, but that each decision must be
made after a consideration of the tactical and strategical situation obtaining at that time.
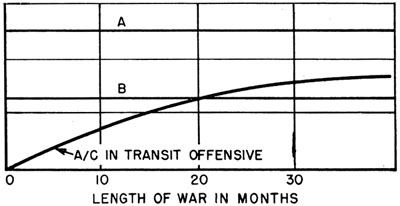 |
FIGURE 4. Relative saving of ships for various uses of aircraft.
(A) Defensive value of escort of all threatened convoys;
(B) defensive value of partial escort of threatened convoys.
|
| 13.3 |
FOLLOW-UP OF CONTACTS |
Probably the most important aspect of offensive operations is the attempt to convert the largest possible fraction of all contacts into attacks and
kills. Often the manner in which contact is made is such that an immediate attack is not possible. (A typical example would be a sighting by a merchant
ship or non-operational aircraft.) It may be that an attack has been made on the sub and contact subsequently lost, so that contact must be regained in
order to continue the attack. In these cases it is usually very profitable to conduct a follow-up search in order to find the sub again.
Follow-up of contacts is a profitable employment of antisubmarine forces because for the first few hours after contact has been lost the region in which
the submarine can be is rather small. In this region the probability density is accordingly high and it therefore constitutes a profitable region for search.
As an example, consider the case of a submarine whose position is definitely known at time t = 0, and is then lost. The submarine is free to travel on the
surface. Since its speed is certainly not greater than 20 knots, we can be sure that it is within a circle of radius 20t miles. The corresponding submarine
probability density is shown in Figure 5, calculated on the assumption that the submarine is equally likely to be anywhere within the
circle, that is, that
 |
Equation (7) |
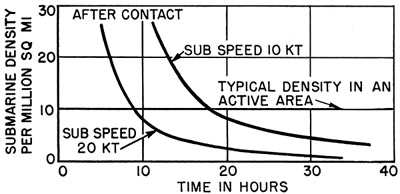 |
FIGURE 5. Local probability density after a submarine contact; calculated from equation (7). |
--147--
The horizontal line drawn for comparison shows a typical average U-boat density for an active area during the Atlantic war. The conclusion is that
follow-up of the contact is more profitable than general area patrol for about 10-20 hours after the contact, in this case. If the overall submarine
density is increased, follow-up of contact becomes relatively less profitable, whereas in a region of low density it is Of Utmost importance to exploit
each contact to the full.
Figure 5, drawn for submarine speeds of 10-20 knots, is applicable for surfaced submarines. If the submarine is held down by
aircraft or surface craft, its speed may be considerably less, normally only 2-3 knots for conventional types of submarine. In this case the local
density remains high for a much longer period than is shown in Figure 5. Consequently, sonar search for submerged submarines is
very much more effective in follow-up of previous contacts than in routine area search. Only in areas of great submarine density is it profitable to
employ surface craft for area search by sonar. In general the chief offensive employment of surface craft will be to follow up previous contacts,
appropriate plans and tactics for doing so being of prime importance.
There are, then, two distinct tactical situations, according as aircraft or surface craft are the principal agents of search. If the hunt is being
carried out by aircraft alone, the aim is to recontact promptly any submarine which dares to show itself on the surface. When surface craft are present,
however, the submarine will normally remain submerged. (A coordinated hunt by aircraft should be carried out whenever possible to ensure that the submarine
does not make a high-speed escape on the surface.) So long as the submarine's submerged speed is low, the surface craft's sonar search has a good chance of
resulting in recontact. Of the two problems, that of surface craft search is somewhat the simpler and will be discussed first.
In the actual design of such follow-up searches fur surface craft, two primary requirements must be met In the first place, the search must be as simple
as possible to carry out and involve no more turns or changes in disposition than necessary. Ships should be kept in a line-abreast formation unless there
is some special reason for doing otherwise. Standardized turns and maneuvers should be employed to avoid confusion in operation. In addition the plan
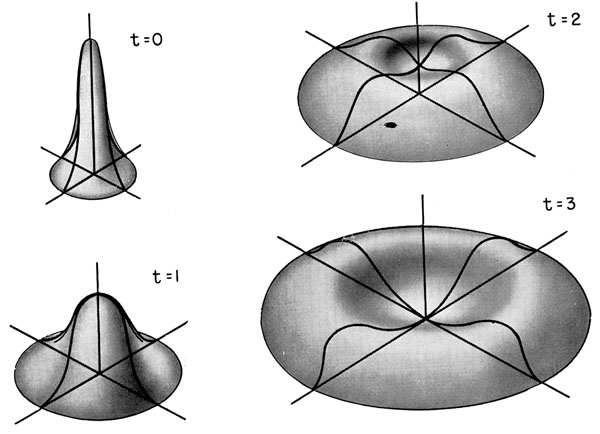 |
FIGURE 6. Submarine probability as a function of time (t = time in hours). |
--148--
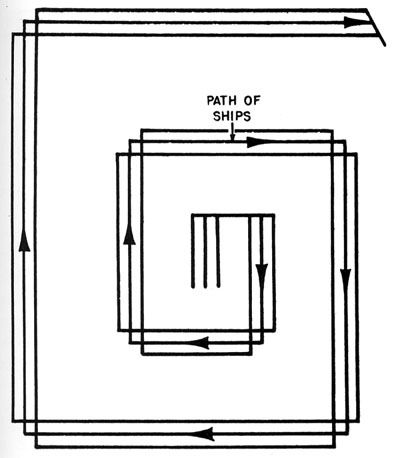 |
FIGURE 7. Typical plan for sonar search by surface craft. |
must search regions in which the submarine is likely to be, in general accordance with the rules of Volume 2B, Chapter 3. In designing the plan, then,
an estimate of probability density distribution as a function of time must be made. Immediately after the original contact the density is very highly
peaked, the only dispersion arising from errors in reporting the contact position, but as time goes on the submarine may move further and further from
the position of the original contact and will probably be at some distance from it. A typical set of densities is shown in Figure 6,
and further discussion of such distributions may be found in Volume 2B, Chapter 1.
It is evident that a search plan drawn up on the basis of such an expanding distribution will usually have the general shape shown in
Figure 7. Extensive sets of such plans are to be found in present doctrine.36
It is not necessary to go through a detailed analysis of probability functions such as those of Figure 6, however, to gain a
general idea of the effectiveness of surface craft follow-up tactics. An analysis of the following type is adequate to indicate the importance of the
factors considered. The fundamental simplification is to replace the surface shown in Figure 6 by a flat-topped cylinder, that is,
to assume that the submarine is equally likely to be anywhere within a certain radius of the initial point and is known to be somewhere within that radius.
It is reasonable to write the radius as
| where |
a = uncertainty in initial position, |
| v = submarine's speed, |
| t = time since initial contact. |
Assume that the increment of probability of having made contact can be written
This assumption implies that the search is carried out at random, but can be used as a fair approximation to an actual search plan. (See Volume 2B,
Chapter 3.) Then
 |
Equation (8) |
The constant of integration in equation (8) is determined by the condition that p=0 at the time of commencing search. If this time is denoted by t1,
 |
Equation (9) |
When a search is being conducted it should normally be carried out until there is nothing to be gained by further searching, i.e., until p(t) is very
near p(∞), which is the ultimate limit. Hence it is useful to write the probability for t =∞, which is
 |
Equation (10) |
Some typical curves plotted on the basis of equation (10) are plotted in Figure 8. A sweep rate of 30 square
miles per hour and a sub speed of 3 knots are assumed. It is evident that a prompt start on the search combined with accurate localization of the contact
are required for a good probability of success.
Operational data are available on success of follow-up hunts aimed at regaining contact with a submarine after lost contact following an attack; these can
be compared with the theoretical predictions. For
--149--
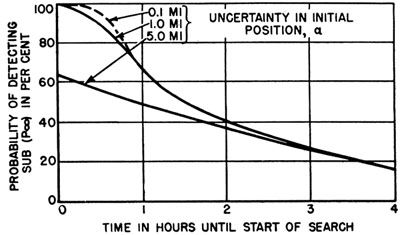 |
FIGURE 8. Probability of catch for: sweep rate 30 sq miles per hour; sub speed of 3 kt. |
cases in which a submarine was believed to be present, the results are presented in Table 10. An average of about two ships took
part in the searches.
TABLE 10. Success of searches to recontact U-boat.
| No. of cases |
Average time
from lost contact
to start of search |
Per cent
successful |
| 19 |
22 min. |
53 |
| 12 |
90 min. |
25 |
These figures are plotted in Figure 9, and a calculated curve is drawn which is in fair agreement with the operational points. This
curve is drawn on the assumption that sub speed is 3 knots, initial uncertainty is 1 mile, and sweep rate is 10 sq miles per hour. The first two assumptions are
reasonable for the tactical situation involved. Since the problem is one of re-contacting a submarine which has been previously attacked, a location error of more
than 1 mile is unlikely. The sweep rate of only about 5 sq miles per hour per ship is somewhat smaller than might be expected, however. In Volume 2B, Chapter 6,
the average sonar sweep width is estimated at 1800 yd, corresponding to a sweep rate of about 10 to 12 sq miles per hour. Several explanations are possible:
- in this case U-boats may have been especially careful to make good use of layer effect and other opportunities to escape detection,
- wakes, depth charge explosions, etc., may have made search more difficult, or
- the previous estimate, based on the assumption that a submarine would have been detected every time at very short range, may have been unduly optimistic.
There is, however, no irreconcilable difference between the theoretical expectations and operational results.
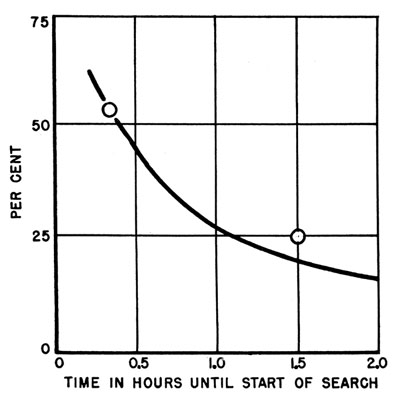 |
FIGURE 9. Per cent of submarines contacted by surface craft hunts. Circles are operational data
on regaining contact. Solid curve is calculated for: Q = 10 sq miles per hour, A = 1 mile, V = 3 kt, by equation
(10). |
Follow-up hunts by aircraft are of two general types. The first of these is aimed at detection of submerged submarines by MAD or sono-buoys, the second
at visual or radar detection of the submarine when it has resurfaced. Aside from special limitations on maneuverability, those of the first type have much
in common with surface craft hunts, since the submarine's behavior is approximately the same. In order to have an acceptable chance of success the search
must be begun very soon after the initial lost contact, and the accuracy of locating the initial point must be high. Since this type of follow-up presents
no essentially new problems, detailed discussion will not be given here.
When, however, the aircraft relies on visual or radar detection, the search must be planned with recognition of the fact that a submerged submarine cannot
be detected. Two alternatives are possible, either a hold-down hunt aimed at covering all possible positions of the submarine so as to keep it from surfacing
until battery and/or crew endurance are exhausted, or a "gambit" procedure in which the aircraft endeavor to permit the submarine to resurface and then
recontact it. This latter alternative is equivalent to designing the search so as to concentrate on those regions in which surfaced submarines are most
likely to be. In practice the gambit procedure has usually involved a box search centered at
--150--
 |
FIGURE 10. Comparison of follow-up hunts. |
the point of last contact and far enough distant that the sub will surface and then try to cross the aircraft's patrol. The hold-down hunt, on the other
hand, must cover the whole possible area of the submarine at frequent intervals. This requires a much larger expenditure of effort, actually far more than
is usually available, as can be seen in Figure 10.
| Hold-down |
Gambit |
| 1. Aircraft must cover area p(ut)2 about 3 times per hour so as to keep sub down at all times. |
1. Aircraft must make circuit 2put in length often enough to prevent crossing on surface. |
| 2. For velocity of aircraft = V, and sweep width w, this requires 3p(ut)2/wV aircraft in the region at time =
t. |
2. For aircraft velocity = V, sweep width w, and sub surfaced speed U, this requires (Us/w)(2put/V) aircraft flying at time =
t. |
3. To carry out from 1 hr to 36 hr with u = 3 kt, w = 10 miles, V = 125 kt, and Us = 15 kt we require |
| 1050 flying hours |
150 flying hours |
Obviously much less flying is required for the gambit procedure than for hold-down, especially since a true hold-down should last for well over 36 hr.
As a matter of fact, there have been very few cases where hunts have been made with sufficient intensity to qualify as true hold-downs offering the submarine
no opportunity for surfacing. A hard and fast distinction cannot be made in the case of actual operations.
TABLE 11. Hours of flying on contact by type of mission.
(Trinidad area).
| |
Total hours of flying |
Avg hours per contact |
Escort
of
convoy |
Routine
patrol |
Hunts |
Escort
of
convoy |
Routine
patrol |
Hunts |
| Aug 1942 |
714 |
1,514 |
134 |
714 |
116 |
45 |
| Sept |
1,085 |
3,405 |
486 |
362 |
227 |
97 |
| Oct |
489 |
3,852 |
701 |
163 |
241 |
88 |
| Nov |
925 |
3,221 |
584 |
--- |
403 |
584 |
| Dec |
635 |
3,171 |
620 |
319 |
3,171 |
124 |
| Jan 1943 |
1,038 |
3,668 |
486 |
519 |
1,834 |
234 |
| Total |
4,889 |
18,831 |
3,011 |
444 |
342 |
125 |
Operational results normally confirm the theoretical expectation that flying on hunts in follow-up of contact is more profitable than any other type
in terms of flying hours required per submarine contact. Table 11 presents data of this sort from the Trinidad Area for the period August 1942 to January
1943. Hunt flying is seen to be three to four times as profitable as other types.
A small number of aircraft hunts have been studied in detail in order to determine the relative effectiveness of different types of follow-up tactics.
Although the number of cases involved was too small to permit great reliance to be placed on the results, they are of interest as confirmation of the
expected trends. A total of 18 hunts are involved, which occurred between March 15, 1943, and October 20, 1943, in the United States Strategic Area.
The overall results are summarized in Table 12.
TABLE 12. Results of aircraft hunts.
(United States strategic area, 1943.)
| Total number of hunts |
18 |
| Hunts achieving recontacts |
11 |
| Per cent of hunts successful |
61 |
| Average duration of hunt (hours) |
59 |
| Total number of recontacts made |
22 |
| Recontacts per hunt |
1.22 |
| Average time between recontacts (hours) |
14.6 |
The effectiveness of these hunts is shown by the fact that 61 per cent of them succeeded in again establishing contact with the submarine. On the
average, subs were recontacted about two times in those cases. A more detailed breakdown of the results is presented in Table 13.
TABLE 13. Comparison of results by hunt type.
| |
Continuous
gambit |
Modified
exhaustion |
Exhaustion |
| Number of hunts |
12 |
2 |
4 |
| Number successful |
9 |
1 |
1 |
| Per cent successful |
75 |
50 |
25 |
| Average flying hours in hunt area |
75 |
280 |
300 |
| Number of recontacts per hunt |
1.33 |
2.50 |
0.25 |
| Flying hours in area per recontact |
58 |
114 |
1,186 |
--151--
This table shows clearly the high effectiveness of the gambit type of hunt in comparison with other types. It ranks well in terms of percentage
success an, average number of recontacts per hunt. Since the number of flying hours employed was much smaller than for the other types, the results
in terms of flying hours required per recontact show a definite advantage to the gambit type.
In connection with the general importance of follow-up hunts, one further remark is worth while. Such hunts are profitable because they are carried
out in a small area in which the submarine probability density is high. For best effectiveness accurate navigation is required to locate the area properly
and to carry out the desired search plan. In addition communications must be excellent in order to assure that the hunting craft reach the submarine
position at the earliest possible moment, since the early stages of the hunt are the most profitable. In order to insure that coordinated follow-up hunts
are carried out successfully, great skill is required in each of these fields.
--152--
Table of Contents
Previous Chapter (12) * Next Chapter (14)
Footnotes
Transcribed and formatted for HTML by Rick Pitz for the HyperWar Foundation


