
You handle spreadsheets every day, though you probably don't realize it.
Here's a typical simple spreadsheet, also known as a grocery receipt:
| Bread | 2.89 | ||||
| Milk | 2.69 | ||||
| Subtotal | 5.58 | ||||
| Tax @.06 | 0.33 | ||||
| Total | 5.91 | ||||
| Cash Tendered | 6.00 | ||||
| Change Due | 0.09 |
Spreadsheets can perform a lot of neat tricks, such as
-- Add, subtract, multiply and divide numbers from different rows and columns.
-- Figure percentages.
-- Sort a large table of multiple rows and columns, according to the data in
a single column. (For example, a table with name, street address, employer,
dollar amount and recipient of political contributions can be sorted by any of those categories:
who gave the most?
how many Smiths gave money?
how many employees of Jones Factory?
who gave money to Mary Doe?)
-- Chart the data so you can interpret it visually.
-- Perform a complex calculation using numbers from points all over the spreadsheet (add column D to column F, divide that sum by column H, subtract 2, and give me that answer as a percentage) -- all in one formula.
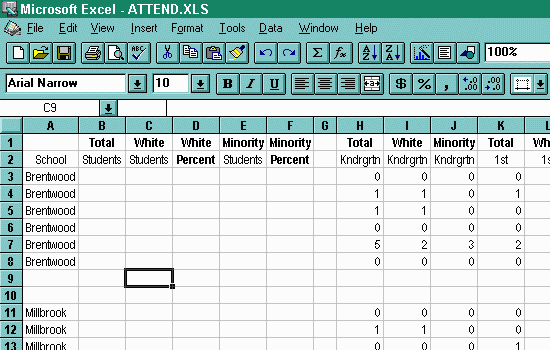
Here's what a typical spreadsheet in Excel looks like:

This spreadsheet contains the total number of students, by race and grade, for
several 'nodes' or neighborhoods assigned to Brentwood and Millbrook schools.
(The spreadsheet continues offscreen to the right, with numbers through
fifth grade.)
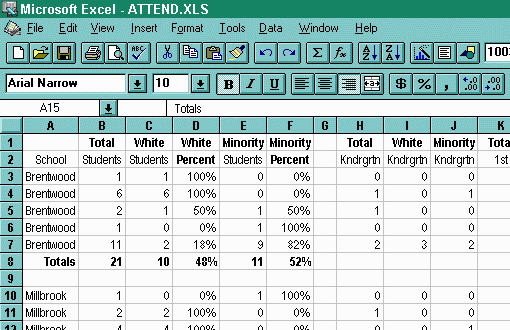
There are empty columns created for figuring the total of all students and
the proportion of each race. Using a few simple formulas, it's only a
matter of minutes to get the results shown below:

If you have other questions about spreadsheets, please ask any of the news researchers or past CAR Fellows for help.
This page was created by Donna Seese
Last updated May 7, 1997