"Swallows" and "shrimps"
2D bifurcation diagram for nonlinear maps
A central feature of a region of periodic stability surrounded by chaotic
behaviour is a point in parameter space at which the map has a superstable
orbit - a periodic orbit which includes a critical point of the map.
Near a superstable period-n orbit, the n-th iterate of the map
is generally well approximated by the quadratic family x →
x2 + c.
In the two parameter case, an orbit will be superstable along a curve in
parameter space. In general one expects that along lines transverse to the
curve of superstability, the bifurcation diagram will resemble the
one-parameter quadratic family.
However, if the map has more than one critical point,
at a point of intersection of two curves of superstability the orbit becomes
"doubly superstable" - to include a second critical point. Near such a point
it is well approximated by the composition of two quadratic map
y' = x2 + c1 ,
x' = y2 + c2 or
x' = (x2 + c1)2 +
c2 ,
and a linear change of coordinates leads to canonical two
parameter biquadratic family [1].
"Shrimps Hunter" controls:
Click mouse in window to find period p of the point.
Click mouse + <Alt>(<Ctrl>) to Zoom In(Out) 2 times.
Hold <Shift> to modify Zoom In/Out x4
Biquadratic maps and Milnor's swallow
Consider entangling of regular and chaotic dynamics regions on 2D parameter
plane. The real biquadratic maps depend on two parameters (A,B)
xn+1 = (xn2 + A)2
+ B.


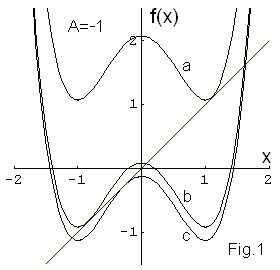
You see in Fig.1 that it can have one or two attracting fixed points.
Each of them attract nearest critical points
x1 = 0 or
x2,3 = ±(-A)1/2,
for A < 0
(it is evident that orbits starting at ±(-A)1/2
coincide). Let A = -1 then for B ~ 1 we see the first tangent
bifurcation and two fixed points stable and unstable appear (the highest curve
- a). Under decreasing B the second tangent bifurcation takes
palce (curve - b). At last in reverse tangent bifurcation stable
and unstable fixed points merge together and disappear (the lower curve -
c).
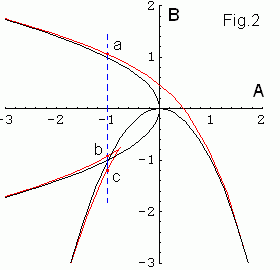
In Fig.2 on the parameter (A,B) plane these three bifurcation
curves are shown in red. Note that the critical point x1 = 0
is fixed at B = -A2 and x2 is fixed at
A = -B2. All these curves make the "Milnor's swallow" shape
[2].
"Shrimps hunter"
For each parameter pair (A,B) the map is iterated 500 times
(starting at one of the critical points) and then the orbit is examined for
periodic behaviour. If the orbit is becoming unbounded a light-grey dot is
plotted. If the orbit is found to approach an orbit with low period the dot is
colored according to the period. If the orbit has period greater then 64
a black point is plotted to enhance the visibility of smaller shrimps.
Note that due to slow convergence near the period doubling
bifurcations there are (non-chaotic) black strips between
zones of different periodicities.
[1] B.R.Hunt, J.A.C.Gallas, C.Grebogi, J.A.Yorke, and
H.Kocak Bifurcation
Rigidity
Physica D 129 (1999), 35.
[2] J.Milnor "Remarks on iterated cubic maps"
Exp.Math. 1 (1992), 5.
Contents
Previous: Chaotic transient
Next: Circle maps
updated 9 Nov 2006

