
Appendix 14
Accuracy Studies of High Frequency Direction Finding Fixes
The overall study of the of the accuracy of high frequency direction finding (HFDF) fixes contained in this report covers the period from April 1943 through April 1945. The following graphs and tables are included:
Table A shows the accuracy of fixes by months for all transmissions for which U-boat positions were available. The distances of the fixes from the U-boat positions are broken down into subdivisions of (a) within 25 miles, (b) 26-50 miles, (c) 51-75 miles, and (d) 76-100 miles. The number of cases in each of these categories is expressed as a percentage of the total number of cases for the month. The figure at the top of each column gives the total number of cases for the month upon which the percentages were obtained. Inspection of this graph shows a gradual improvement in the accuracy of the fixes from April 1943 through August 1945, with the high point being reached in June, July and August 1944. The record from August 1944 on shows considerable variation which may be ascribed to the falling off in the total number of transmissions for this period. The average accuracy for this latter period (September 1944 to April 1945) is, however, on the average as good as the period from February through May 1944. In February 1944 the system was inaugurated of having the OP-20-GT-A Watch Officer consult with the OP-20-GI-A Watch Officer before making a final fix. During the 15 months in which this procedure was followed, suggestions for changes were made in 21% of the fixes. Of these changes, 80% resulted in an improvement of the fix. The high accuracy observed during June, July and August 1944 may very well be ascribed to the fact that it was during this period that the invasion of France occurred, and it is believed that the rise in accuracy of fixes is due to the large majority of U-boat transmissions being concentrated in a very small area in the vicinity of the Bay of Biscay and the English Channel.
Tables B and C give a breakdown of Table A for ENIGMAS and short signals respectively. The accuracy of fixes on ENIGMA transmissions is, as might be expected, slightly higher than those on short signals.
Table D shows the average and median number of miles between HFDF fixes and U-boat positions. The overall average for the entire period studied is 109.4 miles for the average and 82 miles for the median. The dotted line indicating the median number of miles is taken to be more significant since it tends to eliminate errors of a high magnitude which would influence the average out of due proportion.
Table E shows the percentage of unit transmissions giving U-boat positions upon which it was possible to obtain HFDF fixes. The average percentage for the entire period studied is 76.
Tables F, G and H show the various percentages of accuracy of evaluations by the HFDF Watch Officer for all transmissions, ENIGMAS, and short signals respectively. The significant points to be observed on these graphs are (a) that the percentage of fixes correctly evaluated (i.e., a grade of "A" was given to those fixes within 25 miles of the U-boat position, "N" 26-50, "V" 51-75, "L" 76-100, "U1" 101-150, and "U2" over 151 miles) is relatively low, approximately 25%, and (b) that the number of cases correctly graded or better averages approximately 85%. From this it would appear that it is exceedingly difficult for the HFDF Watch Officer to give a correct evaluation within narrow limits but in general tend to be conservative in evaluations.
Table I compares the total number of HFDF cases with the total number of those transmissions containing U-boat positions and those containing U-boat positions with fixes.
Errors in fixes may arise from a complexity of causes: Errors in bearings themselves which may be due to defects or limitations of equipment, or ionosphere conditions. Bearing errors may also be a function of time of day, frequency of transmission, distance and true bearing of the fix, geographical location of the HFDF station, direction of the transmission path with respect to the earth's magnetic field, condition of "storminess" of the ionosphere, etc. Other errors may arise from garbles in transmission of bearing reports, inaccuracies in tracking charts, or inaccurate plotting of bearings on these charts. In addition to these factors there is the personal interpretation of the HFDF Watch Officer along with any mechanical or semi-mechanical procedures he may use in his attempt to establish a fix.
In view of the numerous complex causes which may affect the accuracy of the fixes, this report makes no attempt to
isolate the various factors. It does, however, present an objective study of the effectiveness of the end result of all the factors which go into the making of a HFDF fix.
Table A
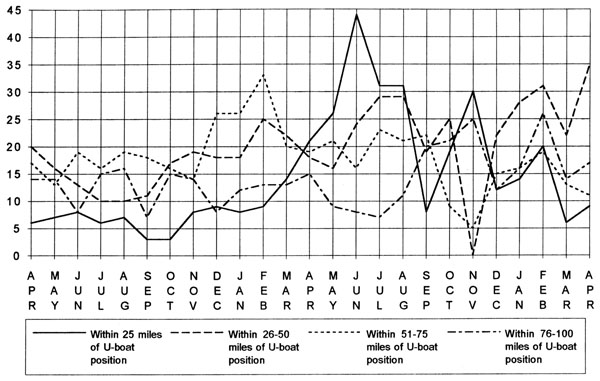
Table B
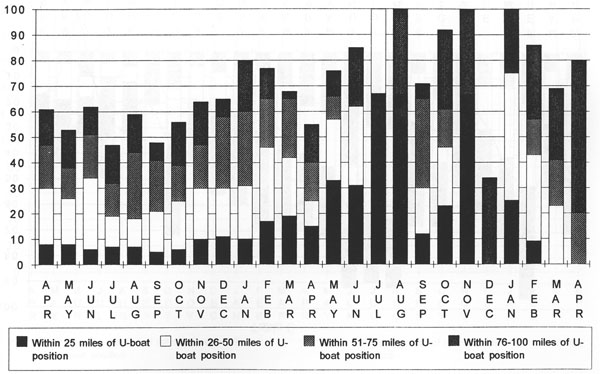
Table C
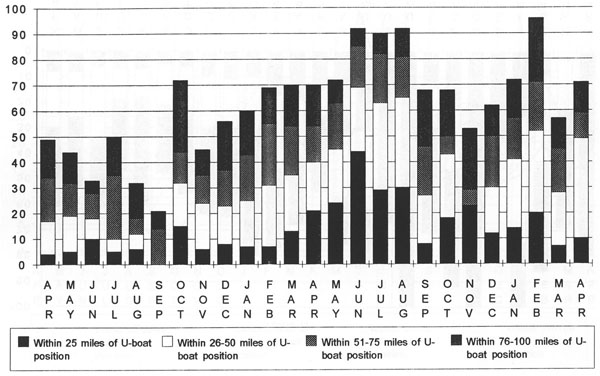
Table D
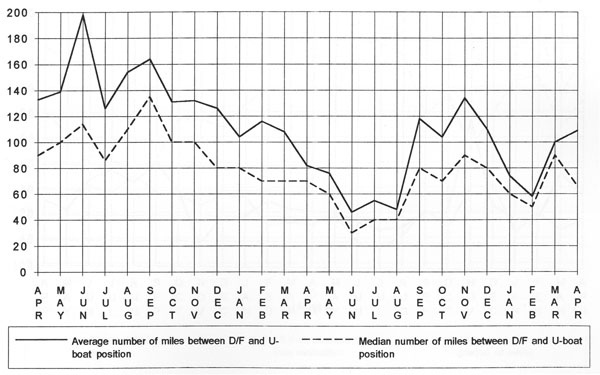
Table E
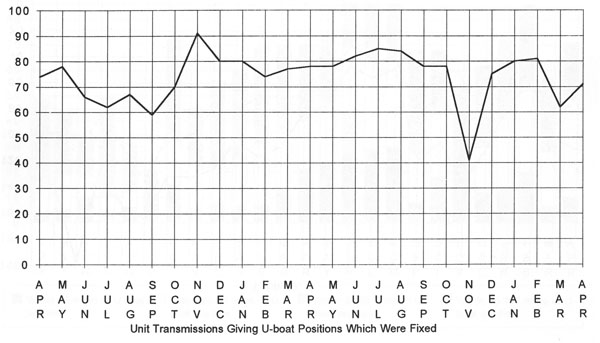
Table F
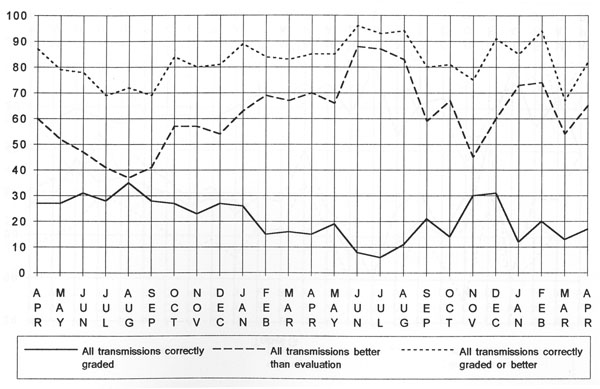
Table G
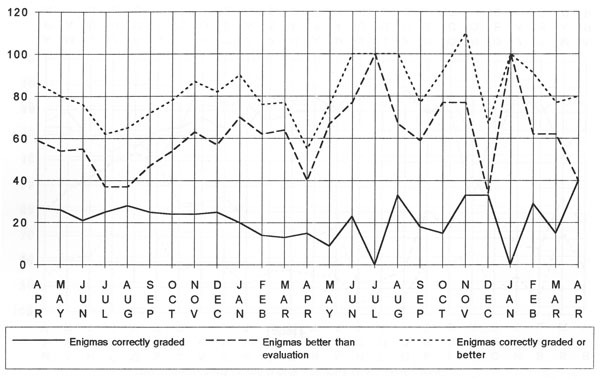
Table H
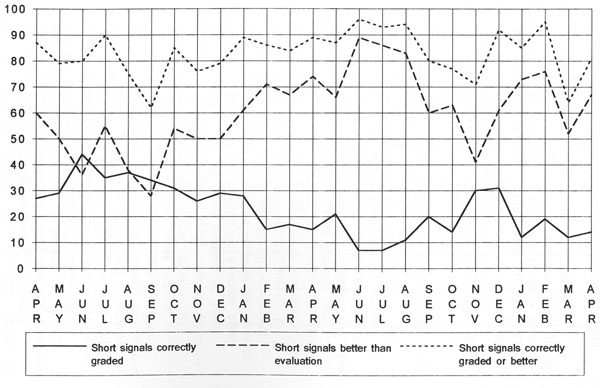
Table I
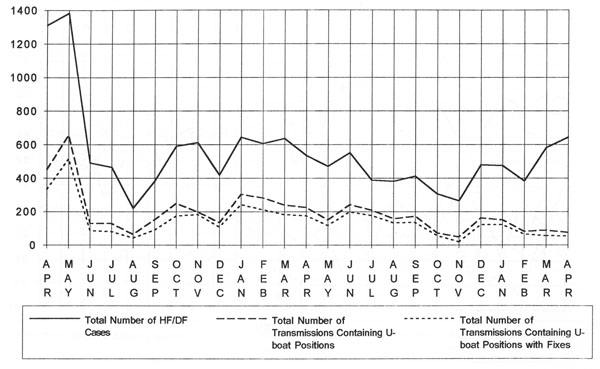
Table of Contents
Previous [Appendix 13] * Next [Appendix 15]