
Chapter 11
ATTACKS BY SURFACE CRAFT
When an antisubmarine ship or aircraft makes contact with a submarine, an attack is normally made in order to sink or damage it. During escort
operations, "embarrassing," or "urgent," attacks may also be made whose chief purpose is to frighten the submarine crew and prevent it from pressing
home its attack on the convoy. This type of attack will not be considered in the following discussion, since its value is largely psychological and
cannot readily be evaluated in quantitative terms. The so-called deliberate attack, on the other hand, aims to destroy the submarine, and this aim can
be expressed mathematically. In designing attack weapons and tactics the objective is to make the probability of destruction a maximum. The problems
which arise in doing so will now be analyzed.
| 11.1 |
GENERAL STATEMENT OF PROBLEM |
As is true in the other aspects of antisubmarine warfare [ASW] discussed in the previous chapters, the basic principles of attack are simple to describe.
It is only when these principles are examined in more detail that complicated problems arise. So before passing to the details of the attack consider the
overall picture of a surface craft attack against a submarine, first in terms of an a priori analysis and then in terms of an a posteriori analysis of operational
results. These two points of view will also be employed in the later detailed discussion.
| 11.1.1 |
Theoretical Analysis |
From the theoretical point of view we are interested primarily in attacks against submerged submarines, though an antisubmarine action often involves
gunfire or ramming when the submarine is surfaced. The submarine may have been detected on the surface initially, or it may have been forced to the surface
by previous attacks. In either case the ensuing action on the surface is little different from any other surface action and needs no consideration here.
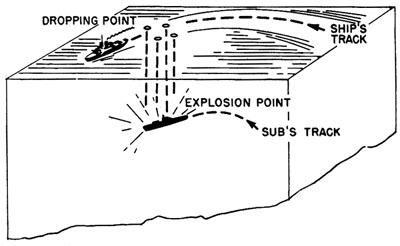 |
FIGURE 1. Stern-dropped attack. |
When the presence of a submerged submarine has been detected by sonar, the initial step in the attack is to "localize" the submarine, i.e., to determine
its range and bearing from the attacking ship. On the basis of continuing range and bearing data, the submarine must then be "tracked" in order to determine
its course and speed. Sometimes this is done explicitly by plotting positions, but more often it is done implicitly.15 Finally, the attacking ship must maneuver
into a position such that when it launches its explosives they will reach a point beneath the surface at the same time as the submarine reaches that point.
Figure 1 illustrates a typical attack in which the barrage is laid off the stern and to the quarters of the attacking ship, and Figure 2 illustrates an attack in
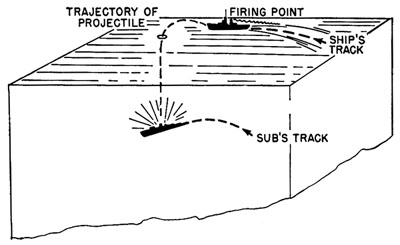 |
FIGURE 2. Ahead-thrown attack. |
--113--
which the explosives are thrown ahead of the attacking ship. These explosives may be activated by contact fuzes as in the case of Mousetrap or Hedgehog
projectiles; by proximity fuzes, as in the case of Mk 8 and Mk 14 depth charges; or by depth fuzes, as in the case of conventional depth charges or "Squid."
If the attacks illustrated in Figures 1 and 2 are to be successful, the charges must explode sufficiently close to the submarine either to rupture its pressure
hull and cause immediate sinking or to damage the hull sufficiently to force it to the surface where it can be sunk by gunfire or ramming.
| 11.1.2 |
Operational Studies |
Theoretical investigations usually involve a de-tailed analysis of the attack problem, but this is not possible in the case of studies based on operational
data because of the nature of the information available. The primary source of data for operational analysis is the action report prepared by each vessel which
has made an attack. All attacks made on the same submarine during a more or less continuous engagement are grouped as one incident, whose results are assessed by
the appropriate committee. The assessments are graded A to J as follows.
- Known sunk.
- Probably sunk.
- Probably damaged, possibly sunk.
- Probably damaged.
- Probably slightly damaged.
- Insufficient evidence of damage.
- No damage.
- Presence of submarine uncertain.
- Target attacked not a submarine.
- Insufficient evidence to assess.
Assessments of this type have a number of limitations as a measure of the success of the attack. In the first place, there is often some uncertainty as to
whether the target attacked really was a submarine. If the submarine is not seen at any time, it is difficult to resolve this uncertainty on the basis of sonar
data, and many attacks must consequently be assessed H. The usual solution is to eliminate from any analysis all attacks assessed H, I, or J. This is by no means
a perfect solution, however, for a submarine is probably present in a considerable number of H attacks. Assessment of damage is also somewhat uncertain since debris
and other visible evidence may not in any particular case give a very accurate indication of the actual damage inflicted on the submarine. For purposes of analysis
the assessments are usually grouped in the following categories.
| Sunk |
A, B |
| Damaged |
C, D, E |
| Undamaged |
F, G |
| Non-submarine |
H, I, J |
As shown in Appendix I, the total number of A and B assessments did actually correspond closely to the total enemy submarine losses during World War II.
The other data concerning the attack are often less reliable than the assessment. The submarine's behavior is completely unknown, as a rule, and data from
the attacking ship are likely to be undependable. Ranges, bearings, and times are recorded in the heat of battle or later from memory, and in either case are
likely to be inaccurate (if they arc, in fact, recorded at all). For this reason the recorded data cannot be used as a basis for a reconstruction of the attack
with any high hopes of accuracy. Even in practice attacks, where the data are taken more carefully and submarine maneuvers are known, it is almost impossible to
determine within a reasonable margin for error how close the barrage came to the submarine without some special device for doing so. The detailed course of
events during an attack on any enemy submarine can rarely be determined, so that operational analysis consists of evaluating statistically the effect of
different changes in conditions or methods of attack on the overall success as embodied in the incident assessment. Results of such operational studies can then
be compared with those of theoretical investigations based on a detailed consideration of the factors influencing probability of success. In order to do this
the importance of some of these factors must first be indicated.
| 11.2 |
THEORETICAL DISCUSSION OF FACTORS DETERMINING THE SUCCESS OF ATTACKS |
The factors determining the probability of success in an attack can be grouped in two general categories: attack errors on the one hand and weapon lethality
on the other. The first problem encountered in examining the attack errors in detail is the estimation of errors involved in localization. Ranges and bearings on
the submarine are obtained by sonar,
--114--
which is subject to certain disturbances and limitations. In the first place, echoes are obtained not only from the submarine but from its wake, from water
disturbances caused by previously exploded charges, from the wakes of surface vessels, from the ocean floor (in shallow water), and occasionally from the surface
of the water. A good sonar operator is not easily led into thinking that these spurious echoes originate from the submarine itself, but it is inevitable that a
certain amount of error and confusion creeps into range and bearing information. In addition, an inexperienced sonar operator may easily mistake a false target
for the submarine and hence bring about an attack which is wholly futile. An indication of the importance of such mistakes is given by ']-*able 1 which shows the
frequency of errors in practice ahead-thrown attacks made at sea on "tame" submarines. It will be noted that the percentage of attacks on false targets is
considerable even when an actual submarine is known to be in the immediate vicinity.
TABLE l. Attacks oil false contacts in practice attacks.
| Area |
Type
attacks |
Number
on
submarine |
Number
not on
submarine |
Percentage
not on
submarine |
| Bermuda |
Hedgehog |
64 |
18 |
22 |
| Guantanamo |
Mousetrap |
59 |
10 |
14 |
| Key West |
Hedgehog |
170 |
40 |
19 |
| Key West |
Mousetrap |
575 |
259 |
31 |
| New London |
Mousetrap |
32 |
8 |
20 |
| San Diego |
Hedgehog |
86 |
13 |
13 |
| San Diego |
Mousetrap |
162 |
22 |
12 |
TOTAL |
|
1,148 |
370 |
24 |
Even assuming the contact to be on the submarine (or on some wake disturbance near and moving with the submarine), errors in sonar data are by no means
negligible. Figure 3 shows how errors in range and bearing may be introduced by the submarine's wake, as an example. It has been estimated that the average
overall bearing errors are about 2 degrees if BDI (bearing deviation indicator involving lobe comparison for accurate bearings) is used and 4 degrees and 5
degrees if cut-on bearing procedures are used. The probable range error under the same conditions has been taken as 11 yd. These estimates include a normal
amount of wake echo and other errors usual in sonar operation. These errors are, of course, dependent on sonar conditions and sea state. When sound conditions
are bad, the sonar operator is somewhat more likely to make errors. Roll and pitch of the ship in high seas introduce errors for several reasons. Present sound
gear is not stabilized, so that violent roll and pitch introduce errors in the bearing recorded and also make it difficult for the operator to keep the projector
trained on the target. In addition, operator efficiency is reduced when the operator is training the gear with one hand, holding on to the bulkhead with the other,
and combating seasickness at the same time. The importance of such factors can hardly be determined theoretically, but operational data on the overall effect of
these variables will be presented in a later section.
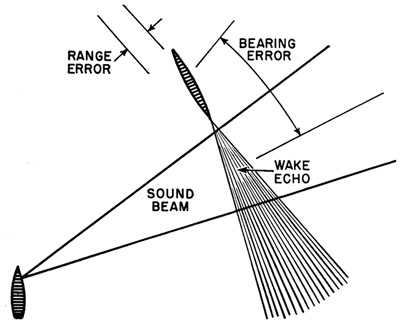 |
FIGURE 3. Errors introduced by wake echo. |
One of the most serious limitations on sonar information is the minimum range at which it can be obtained. Figure 4 illustrates the reasons for this minimum
range with present United States sonar. Because of the limited depression angle of the sound beam, the submarine can pass under it. This causes the ship to
conduct the final part of a stern-dropped attack after contact with the target has been lost. Table 2 gives the average range of lost contact in attacks by
United States surface craft. The increase of
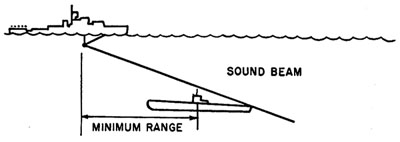 |
FIGURE 4. Minimum range on a deep submarine. |
--115--
TABLE 2. Lost contact ranges.
| Period |
Average range at which
sonar contact was lost |
| July 1942 - Dec 1942 |
176 yd |
| Jan 1943 - July 1943 |
192 yd |
| Aug 1943 - Feb 1944 |
223 yd |
| Mar 1944 - May 1945 |
279 yd |
average range reflects the increase in average depth of submergence of U-boats when attacked.
The maximum sonar range is also of importance, primarily in regaining contact for repeated attacks. If the maximum range is less than about a thousand yards,
the attack is made difficult because the attacking ship cannot maneuver freely and remain in contact with the submarine. For greater ranges, however, maximum range
has little effect on the accuracy of attack.
Sonar ranges and bearings, such as they are, must be used in endeavoring to place the explosives so that they will arrive at a point beneath the surface at the
same time the center of the submarine arrives at that point. How is this placement to be made, and how much in error will it be?
The most important factor in this problem is the "blind time," defined as the time elapsed between reception of the last useful information concerning the
submarine's position and the arrival of the explosives at the predetermined depth. In the case of ahead-thrown attacks the barrage is usually fired before
contact is lost, making the blind time simply the time of flight of the charges plus the time required for them to sink to the proper depth. For a stern dropped
attack the blind time is usually about a minute or more; for an ahead-thrown attack it may be as little as 15 sec. Since these are long enough for the submarine
to move a considerable distance, it is necessary for the conning officer on the antisubmarine ship to estimate this movement and allow for it in placing his
barrage. Figure 5 shows the tracks of ship and submarine in a typical depth-charge attack and indicates the necessity for taking the blind time into consideration.
In this case 50 seconds elapse between loss of contact and explosion of the depth charges. It is necessary for the conning officer to track the target from
time 0 sec to time 40 sec, determine its course and speed, either implicitly or explicitly, and then, on the basis of this information, determine where it will
be at time 90 sec.
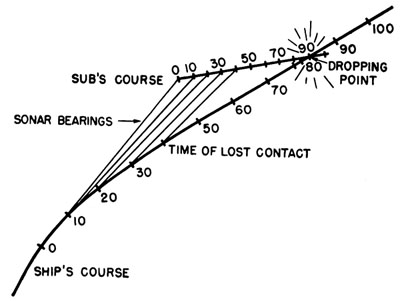 |
FIGURE 5. Plot of typical attack (figures give time in seconds). |
In carrying out an attack the conning officer does not know the submarine's motion beforehand but must infer it from sonar range and bearing data. Normally
this tracking is done implicitly as ranges are plotted on the sound range recorder in such a way as to allow rapid determination of the rate of change of range.
From this information the recorder computes the time to fire the barrage. To determine the course which should be steered in order to place the charges at the
proper point, the conning officer ordinarily observes the rate of change of bearing and applies lead angle according to simple rules. Frequently, however, the
attack is carried out by watching the plot of the attack furnished by the antisubmarine attack plotter. In this case a plot quite similar to that of
Figure 5 is presented. The conning officer estimates the geographical position of the submarine at explosion time (90 sec in
Figure 5) and steers his ship accordingly. Here tracking is quite explicit.
Now, errors in placing the barrage of explosives in the attack are intimately related to blind time, method of tracking, and sonar
errors. Figure 6 is a simplified illustration of this relationship. Suppose we have tracked the submarine from point A
to point B, at which point we lose contact with it. Because of the sonar errors the submarine will probably lie within a distance e of
point B at the time of lost contact, where e is the probable error16 in location. Furthermore, because of these sonar errors the exact
--116--
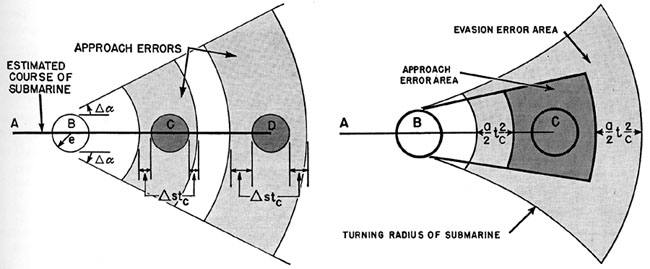 |
FIGURE 6. Diagram of attack errors. |
FIGURE 7. Attack and evasion errors. |
course and speed of the submarine at point B are not known. Suppose that the probable error in course estimation is  and the probable error in speed
estimation is
  . Now suppose that we estimate C to be the point at which the submarine and the barrage will arrive simultaneously, that is, the point of
explosion of the charges. Then the blind time t, is the time required for the submarine to travel at its estimated speed from B to C. Because of the errors
involved, the submarine is not likely to be at point C at the time the charges arrive there, but probably will be somewhere within the shaded area around C.
The probable error in the attack (the typical distance between the center of the barrage and the center of the submarine at the time of explosion) will be
approximately proportional to the square root of the area. If the blind time were longer so that D was the estimated point of explosion, the shaded area would
be larger, and hence the probable error of the attack would be larger. It is apparent from Figure 6 that the area within which the submarine lies is
approximately proportional to the square of the blind time and, therefore, that the probable error in the attack is approximately proportional to the blind time.
In Figure 6, however, we have assumed that during the blind time the submarine maintains the same course and speed it had at point B where contact was lost.
In this case the error in the attack is called the approach error. Unfortunately, submarines can and do change their course and speed very considerably, giving
rise to an evasion error as well. Figure 7 is, therefore, a more realistic picture of the area within which the submarine may lie after a blind time t, This area,
it will be noted, is made up of two parts, one of which is the approach area of Figure 6, the other an evasion area dependent on the turning circle of the submarine,
its acceleration a and the blind time t, This second area measures the submarine's evasive capabilities and increases in size approximately as the cube of the blind
time. The total shaded area in Figure 7 represents the total plan error in placing the barrage. If the three sources of error are assumed to be independent, the
effective area in which the submarine may be is written as in equation (1),
 |
Equation (1) |
on the assumption that errors in estimating submarine velocity are proportional to the velocity. A more complicated assumption would replace the v2 term with
other powers of v, not greatly altering the dependence of A on v. The k's are constant, v is the submarine speed, and t is the blind time. To calculate the values
of the k's from physical characteristics of the gear which is used is an involved process, and therefore we will merely consider them as empirical constants.
Analysis of experimental data derived from practice attacks at sea and on the attack teacher has shown that the distribution of attack errors is in most cases
similar to a Gaussian distribution. For purposes of calculation, therefore, it is frequently assumed that the attack error distribution is, in fact, Gaussian.
--117--
TABLE 3. Errors in practice attacks.
Example
number |
Type of
attack |
Reported
by |
Method
of attack |
Submarine
course |
Submarine
speed
(knots) |
Average
range
of lost
contact
(yards) |
Sinking
time
(seconds) |
Average
attack
error
(yards) |
| 1 |
Stern-dropped |
ASDevLant |
Attack teacher |
Straight |
0 |
200 |
25 |
55 |
| 2 |
Stern-dropped |
ASDevLant |
Attack teacher |
Straight |
3 |
200 |
25 |
91 |
| 3 |
Stern-dropped |
ASDevLant |
Attack teacher |
Straight |
5 |
200 |
25 |
99 |
| 4 |
Stern-dropped |
ASDevLant |
Attack teacher |
Straight |
7 |
200 |
25 |
124 |
| 5 |
Stern-dropped |
ASDevLant |
Attack teacher |
Highly evasive |
5 |
200 |
25 |
117 |
| 6 |
Stern-dropped |
ASDevLant |
Attack teacher |
Evasive |
7 |
200 |
25 |
152 |
| 7 |
Stern-dropped |
ASDevLant |
At sea |
Evasive |
About 3 |
Less than 100 |
25 |
55 |
| 8 |
Stern-dropped |
COCTLant |
At sea |
Highly evasive |
About 5 |
Over 100 |
20 |
170 |
| 9 |
Ahead-thrown
(Hedgehog) |
CIT |
At sea |
Evasive |
About 3 |
Not lost |
12* |
41 |
* Includes time of flight.
Equation (1) indicates that the corresponding probable error would be given by
 |
Equation (2) |
| where |
E = |
radial probable error of attack, |
| v = |
submarine speed, |
| t = |
blind time, |
| K1, K2, K3 = |
empirical constants. |
Equation (2) must be considered as an approximate expression in which the coefficients vary widely according to the evasive capabilities of the submarine and
the tracking capabilities of the antisubmarine ship. The important point is merely that the attack error increases rapidly with increasing blind time, so that
the chief problem in improving the effectiveness of antisubmarine attack is that of reducing the blind time.
The probable error E described above is a horizontal or plan error only. A vertical or depth error is also present in most attacks because of uncertainty
as to the depth of the submarine. Very few United States ships have been fitted with depth-determining sonar, and consequently errors in estimation of depth have
been large. A rough estimate is given by the range at which contact is lost, but it is not at all reliable. Means of reducing the depth error are, therefore, of
very great importance.
Having considered the various sources of attack error, we must now determine what the overall magnitude of the error E is under some typical conditions.
It is not possible to determine attack errors from operational data, since we do not have sufficiently detailed data concerning attacks on enemy submarines. There
is, however, a fairly considerable amount of data available from practice attacks where records are sufficiently complete. Two sources are available. One consists
of the runs made on the attack teacher, which is a mechanical device for reproducing the conditions of an attack at sea; the other, of practice attacks made at sea
against friendly submarines. Table 3 presents representative data from both sources. In all these attacks the depth of the submarine was known,
so that only plan errors are involved.
The first conclusion which can be drawn from Table 3 is that the attack errors increase with increasing submarine speed, other things being equal. This is
shown by comparison of examples 1, 2, 3, and 4. There are a number of reasons for this increase. The distance traveled by the submarine in the blind time is
increased by higher speed, so that the shaded areas shown in Figures 6 and 7 arc larger for higher speeds. In addition the average blind time is increased
because the majority of attacks end with the submarine heading away from the ship, in which case high submarine speed results in a low rate of closing the
range. Finally, attack on a high-speed submarine may require somewhat more difficult maneuvering by the attacking ship.
Examples 5 and 6 show somewhat greater errors than do examples 3 and 4 because of the submarine's evasive maneuvers, but the difference is not so large
as might be expected. In these attacks however, the non-evasive attacks were mixed with the evasive ones so that the conning officer did not know ahead of
time whether the submarine would evade or not. In
--118--
such a case erroneous indications of evasive maneuvers are frequently acted upon and the charges dropped in the evasion area of Figure 7
rather than in the approach area. Thus an evasive error exists, in effect, whether the target actually evades or not, as long as it has evasive capabilities which the
attacker thinks it might use. The errors given in examples 1 to 6 can, however, be well represented by an equation of the same type as (2), namely,
 |
Equation (3) |
This is done in Figure 8, and it is observed that the agreement is good.
Examples 7 and 8 show the large effect of training on the accuracy of attack. The short lost contact ranges and low speed involved in example 7 would
lead one to predict an error of about 75 yd on the basis of the curves in Figure 8. The small observed error, 55 yd, probably indicates exceptionally high
skill on the part of this ASDevLant team. In the case of example 8, the expected error would be about 115 yd for a 5-knot submarine, but the actual probable
error was 170 yd. This effect might be expected, since crews in the training at COTCLant were probably a good deal less skillful than the ASDevLant teams,
because of less training and experience.
Of particular importance is the figure for ahead thrown attacks in example 9. The error given, 41 yd, is less than that for stern-dropped attacks on a
stationary submarine in example 1. It is reasonable to conclude that the errors involved are those of locating the submarine-the term K,-and that the
blind time for these ahead-thrown attacks is short enough largely to eliminate submarine evasion error and prediction error (the K3 and K. terms).
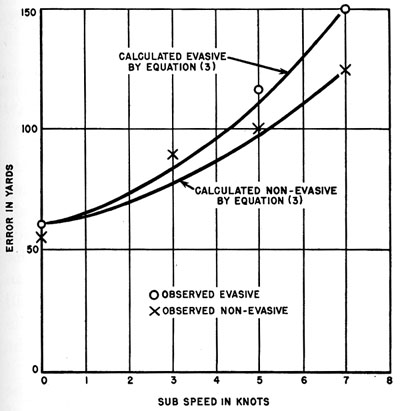 |
FIGURE 8. Probable attack errors (Table 3, examples 1 to 6). |
So much for the attack errors. We are not interested in them for their own sake, but only for their effect on the probability of success in an attack.
The next step is to determine the probability of a barrage launched in an attack proving lethal to the submarine. In order to calculate this probability
of lethality or "effectiveness," both the attack errors and the characteristics of the barrage itself must be taken into account.
The method of taking the characteristics of the barrage into account can best be made clear by an example. Suppose we are dealing with a depth charge
barrage such as the one shown in Figure 9. If a depth charge explodes immediately alongside of the submarine, it will undoubtedly make a large hole in the
pressure hull and almost surely sink it. If the depth charge is many miles away, it will cause no damage. The transition between these two situations is
probably a gradual one with a considerable region in which an exploding depth charge may sometimes cause the submarine either to sink or to surface and may
sometimes fail to do so, depending on the strength of the particular submarine and on the morale and skill of its crew.
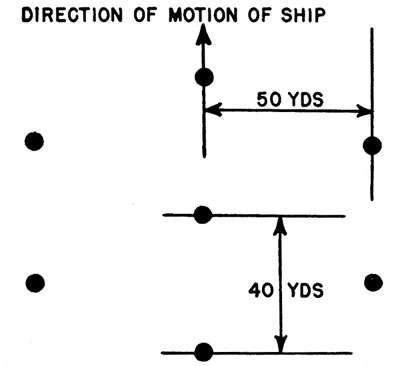 |
FIGURE 9. Seven-charge depth-charge pattern (hypothetical). |
--119--
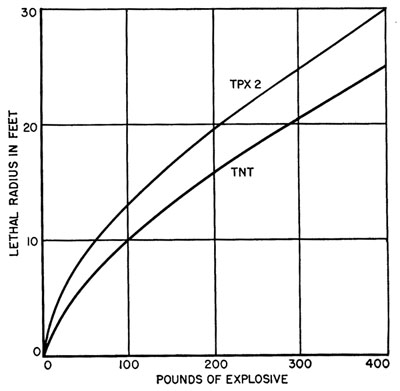 |
FIGURE 10. Comparison of lethal radii of Torpex 2 and TNT (7/8-in. HTS hull). |
Experimental evidence suggests that the pressure hull will be split if the charge explodes within a certain lethal radius of it. The lethal radius
depends on the weight and type of explosive and on hull thickness, but its exact determination is difficult. The ideal method of determination would
involve actual tests against enemy submarines, but this is rarely possible and most tests are made on models. In Figure 10 curves showing the lethal
radius for TNT and Torpex as a function of charge weight are given for a 7/8-in. HTS hull.
Although these curves cannot be taken as giving exact lethal ranges, it is believed that they give a good indication of effectiveness against the
types of submarines encountered in World War II. In order to simplify calculations it is usually assumed that all charges exploding within a fixed
lethal (or surfacing) radius cause lethal (or surfacing) damage and that no others are effective. For any given position of an exploding depth charge
there is, then, a "commanded volume" which has the property that any submarine whose center lies in the commanded volume is sunk, but any other
submarine is unaffected.
| 11.2.2 |
Calculation of Barrage Lethality |
The actual method of using the commanded volume to calculate the effectiveness of a barrage follows. First, a three-dimensional outline of the
pressure hull is drawn around each charge, centered at the charge's explosion point and oriented at the appropriate target angle (for example, 150
degrees). An envelope is drawn around these outlines so that it is everywhere 21 ft from them (for lethal radius of 21 ft). The results of this
construction are shown in Figure 11.
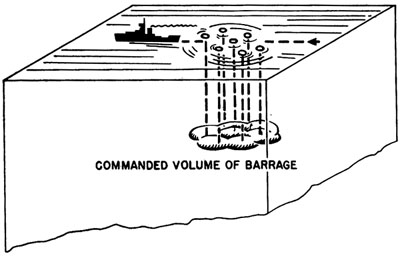 |
FIGURE 11. Commanded volume for hypothetical barrage. |
Now if the center of the submarine lies within these commanded volumes of Figure 11, it will be sunk. Therefore to determine the lethal probability
of the barrage it is only necessary to determine the probability that the center of the submarine will lie within the commanded volume. This probability
is determined by the distribution of attack errors, denoted by p(x, y, z), defined so that p(x, y, z) dxdydz is the probability that the center of the
submarine will be in position (x, y, z) relative to the center of the barrage at the time the charges explode. The probability P that the center of the
submarine will lie in the command volume is
 |
Equation (4) |
The integration indicated in equation (4) is ordinarily carried out by graphical methods, working first with the plan errors, then with errors in
depth. Since the commanded volume varies with orientation of the submarine, the process must be carried out for a number of target angles in order to
obtain an average effectiveness for the barrage. The overall conclusion, however, is obvious - P increases with increase in the commanded volume and
decreases as the attack errors increase.
The commanded volume depends, of course, on the type of ordnance employed. Suppose that a barrage of contact-fuzed charges, rather than depth charges, had
--120--
been considered in the above discussion. The commanded volumes of Figure 11 would then consist of cylinders having a cross section approximately
equal to that of the submarine17 and extending from the arming depth down to the floor of the ocean. In this case the commanded volume would be much
larger than for depth charges. If depth errors are large, that is, if p(x, y, z) has an appreciable value over sonic two or three hundred ft in depth,
this additional volume would result in a larger value of P - a more effective barrage for the contact charges. If, on the other hand, the depth errors were
limited to 30 ft or so, the greater concentration of the depth-charge commanded volume within this region due to greater lethal radius will cause the value
of P to be larger for the depth-charge case than for the contact-charge barrage. In general, depth errors are very large with present United State's equipment
so that the additional commanded volume of contact charges has been a point very much in their favor. Like contact charges, proximity charges cover a wide
range of depth. Their commanded volumes are cylinders of cross section approximately equal to that of a depth charge. This being so, the amount of commanded
volume of proximity charges lying within the desired depth range is always as great as, or greater than, that of depth charges. Charges equipped with proximity fuzes are, therefore, as effective as similar charges equipped with depth pistols when depth errors are small and many times more effective when depth errors
are large.
TABLE 4. Theoretical effectiveness of antisubmarine barrages.
| Weapon Type |
Submarine depth
assumption |
Fuze |
No. of
charges |
Lethal
radius
(feet) |
Probable
effectiveness
(per cent) |
| Side-stern-launched depth charges |
Equally likely from 100-300 ft. depth |
Depth pistol |
9 |
21 |
6 |
| Side-stern-launched proximity charges |
Equally likely from 100-300 ft. depth |
Influence pistol |
9 |
21 |
24 |
| Hedgehog (Mk 10) |
Equally likely from 100-300 ft. depth |
Contact |
24 |
Contact |
28 |
| Mousetrap (Mk 22) |
Equally likely from 100-300 ft. depth |
Contact |
16 |
Contact |
28 |
| Squid |
At 200 ft. depth with 30-ft standard error on account of depth-determining feature |
Depth pistol |
3
or
6 |
21 |
16
or
26 |
Figures for the effectiveness of various types of barrages are presented in Table 4. The theoretical advantage of ahead-thrown weapons due to decreased
blind time (and greater commanded volume for Hedgehog and Mousetrap) is clearly shown. At first thought one might expect the Squid to be much less effective
than Hedgehog because it employs depth charges rather than contact-fuzed charges, thereby commanding a much smaller volume. Squid is used, however, in conjunction
with depth-determining gear which lowers the probable depth error to a point where the large lethal radius of the Squid largely makes up for the Hedgehog's ability
to cover a large range of depths. In addition, the higher sinking speed of the Squid projectile gives a somewhat shorter blind time. For very deep submarines this
becomes important and Squid is considerably the more effective weapon. It has the extra advantage that non-lethal barrages may still bring the submarine to the
surface where it can be sunk by other weapons.
| 11.2.3 |
Calculation of Probability of Success per Incident |
Up to this point only single attacks have been discussed. Usually, however, an action against a submarine consists of a number of attacks which are grouped
together as an incident for purposes of assessment. Unfortunately for the antisubmarine team, it cannot always deliver as many attacks as it may wish. In the
first place, contact is usually lost for the reason illustrated in Figure 4. Contact may also be lost during an attack as a result of water disturbances of one
kind or another. In the second place, there
--121--
is never a 100-per cent probability of regaining contact once it has been lost. The formation of wakes, knuckles, and explosion disturbances often
causes contact to be lost permanently after a small number of attacks. A well-trained team working in good sonar conditions will not experience great
difficulty in regaining contact, but a poor team working under poor conditions will find it almost impossible to do so. The theoretical probability of
success in an incident is thus a function both of the probability of success in a single attack and of the probability of regaining contact after the
attack. On the assumption that the probability of regaining contact after an attack is a constant, independent of the number of attacks previously made,
the following equation can be written.
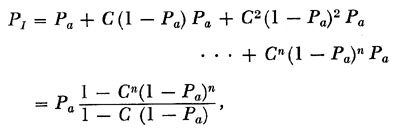 |
Equation (5) |
| where |
PI = |
probability of success per incident, |
| Pa = |
probability of success per attack, |
| C = |
probability of regaining contact, |
| n = |
total number of attacks which can be delivered without exhausting ordnance. |
Operational data indicate values of C varying from 0.50 to 0.90, depending on the number of ships present, period considered, and other factors.
Table 5 presents some typical values.
TABLE 5. Probability of regaining contact.
| |
Single ship |
Coordinated group
of ships |
| Jan 1943 - July 1943 |
0.54 |
About 0.8 |
| Aug 1943 - Feb 1944 |
0.68 |
About 0.9 |
Since the probability of success per incident is much improved by an increase in probability of regaining contact, this is a strong argument for the
use of coordinated groups of ships.18
Although this discussion has presented by no means all details of attack theory, the main ideas have been mentioned. Accordingly, it is now desirable
to consider operational data which can be compared with the theoretical predictions.
| 11.3 |
OPERATIONAL DATA ON EFFECTIVENESS OF ATTACKS |
The data available concerning attacks on enemy submarines are not sufficiently complete to enable one to reconstruct the details of each attack. For
each incident (which may involve several attacks) certain basic information can be obtained as to the conditions under which attacks were made, the weapons
used, the ships involved, and the resulting success as expressed in the assessment of the attack.19 Most analyses of operational data therefore consist of
breakdowns to determine the effect of changes in the conditions or nature of attack on the success as evidenced by the assessment. Some figures of this type
will now be presented which are typical of the results obtained from operational data.
| 11.3.1 |
Factors Influencing Attack Errors |
As was pointed out in the previous section, two overall factors determine the probability of success in an antisubmarine attack: the attack errors
and the weapon effectiveness. One of the variables which is of importance in determining accuracy is the state of the ocean with respect to sound transmission.
If sound conditions are bad, the overall effectiveness of the ships will be reduced. Data are presented in Table 6 which show that such
is indeed the case.20 These figures, it should be noted, are given
on a "per incident" basis. The effectiveness of an incident depends both on the probability of success in a single barrage and on the number of barrages that
can be dropped in an incident before contact is lost.
--122--
TABLE 6. Effect of sonar conditions on attack effectiveness.
Sound
conditions |
Number of incidents |
Percentage of
damaging
incidents |
Assessed
A-G
| Assessed
A-E
|
| Good - Fair |
120 |
27 |
22 |
| Poor - Bad |
74 |
5 |
7 |
Through the combination of these effects, good sound conditions lead to a larger fraction of submarines damaged or sunk per submarine encountered.
Another source of error and difficulty in localizing the submarine with sonar is the roll and pitch of the ship. Present sound projectors are not
stabilized, so that if the ship rolls and pitches violently, the operator has difficulty in keeping the projector pointed at the target. Much information
is lost in this manner, and, furthermore, rather serious errors may be noted in the bearings if they are taken at one or the other extreme of the ship's
roll. In addition, general operator efficiency is reduced under such conditions. The figures given in Table 7 show that such an effect apparently becomes
important in seas classed as rough or higher. (The numbers are too small to give definite proof.) Moderate seas show no deleterious effect, however,
possibly because smooth seas are likely to be accompanied by thermal gradients and layering which cause poor sound transmission.
TABLE 7. Effect of sea state on attack effectiveness.
(U. S. attacks from July 1942-July 1943.)
| State of sea |
Number of incidents |
Percentage of
damaging
incidents |
Assessed
A-G
| Assessed
A-E
|
| Calm, smooth, slight |
16 |
20 |
17 |
| Moderate |
50 |
10 |
20 |
| Rough and higher |
13 |
1 |
8 |
The attack errors depend on many things besides oceanographic conditions. The type of ship and sound gear involved in the attack have a great deal
to do with it, as do the experience and skill of the attackers, the depth, speed, and evasive maneuvers of the submarine. Concerning the last we have
no information since we do not know what the enemy submarine really did in any of the attacks. The type of sound gear involved is undoubtedly of importance,
but United States experience involved only one general type of sonar gear. Even variations such as use of BDI would not be expected to result in a major
increase in effectiveness such as would be clearly evident in operational data. A considerable number of Japanese attacks were, however, made using
listening gear only. Comparison of their effectiveness as estimated from United States submarine experience with that of echo-ranging attacks is made
in Table 8. The difference between attacks of the two types is very striking and must be largely due to the superior accuracy of echo-ranging gear.
The difference between United States and Japanese echo-ranging attacks is probably largely due to differences in skill of personnel involved, though
United States gear was undoubtedly the better of the two.
TABLE 8. Effectiveness of listening and echo-ranging attacks.
| |
No serious
damage
(per cent) |
Major
damage
(per cent) |
Submarines
sunk
(per cent) |
Jap attacks on U.S. subs
(July 1, 1943 - March 31, 1944)
Listening
Echo-ranging |
99
87 |
1
12 |
0
1 |
U.S. attacks on U-boats
using echo ranging
1943
1944 |
85
65 |
10
5 |
5
30 |
The effect of training and experience on the part of the attack team is one which was of extreme practical importance in the Battle of the Atlantic.
Perhaps the best example of improvement with experience is a set of figures on the success of Hedgehog attacks compiled by the British. The data are
given in Figure 12. The rise from an effectiveness of 7.5 per cent per attack in 1943 to over 20 per cent in late 1944 and 1945 must
be ascribed largely to training, since there was no radical change in the type of sound gear used, nor in the enemy's evasive tactics. The values
in Figure 12 are given on a per attack basis,21
unlike those in Tables 6 and 7, which are on a per incident basis. Consequently, any changes in the number of
attacks made per incident should not affect these values. The individual attacks made were undoubtedly more accurate in the recent periods than they
--123--
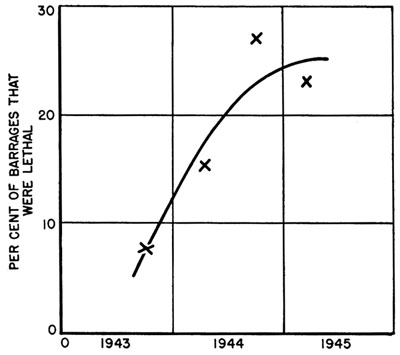 |
FIGURE 12. Success of British Hedgehog attacks. |
were when the weapon was new and crews inexperienced in its use.
It is evident that the points plotted in Figure 12 indicate a marked rise in effectiveness to a value of about 20-30 per
cent, in accordance with the theoretical figures in Table 4. In the first months of Hedgehog use, its results were very disappointing,
since earliest theoretical predictions were more optimistic than 28 per cent. After the weapon had been in use for a year or so, however, it was used much
more effectively, and theoretical studies were made somewhat more conservative as a result of a better understanding of the problems involved, so that the
theoretical predictions and the results now agree.
The effect of experience and training can also be illustrated by the results obtained by United States crews in depth-charge attacks during the early
years of the war. Figure 13 shows two curves-an effectiveness per charge and an effectiveness per incident. The increase in probability
of success per incident is obviously greater than the increase per depth charge dropped. The latter measures the increase in attack accuracy, whereas the
overall figure also depends on the number of charges dropped per incident. In Figure 13B the theoretical effectiveness per depth charge is given for comparison
with results achieved. In the early period there was a considerable discrepancy, but the agreement became fairly good in later periods. The even more abrupt
rise in Figure 13A indicates that larger barrages, greater skill in regaining contact, and more frequent coordinated attacks contributed a great deal to
increase the overall effectiveness of incidents.
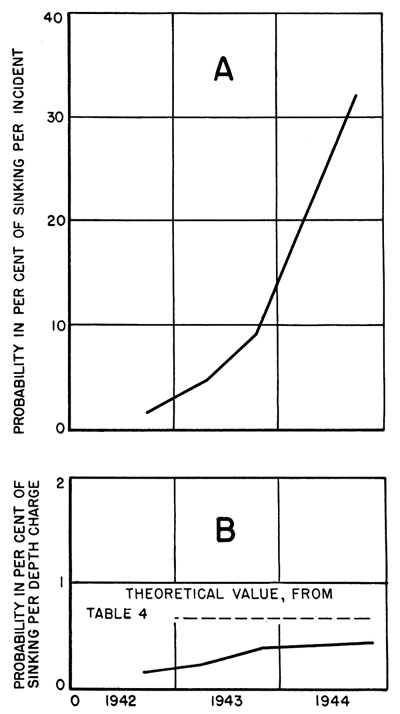 |
FIGURE 13. Success of U. S. depth-charge attacks. |
| 11.3.2 |
Comparative Effectiveness of Weapons |
So much for the influence of factors having to do with attack accuracy. The weapon used is also of importance, and operational data can be used to
show the relative merits of different types of ordnance. The most widespread innovation in the course of World War II was the introduction of Hedgehog.
A comparison between Figures 12 and 13 suggests that operational data do bear out the theoretical value of the
Hedgehog attack. A direct comparison is presented in Table 9. There is a training factor which must be kept in mind. During the early
periods Hedgehog was not used in such a way as to realize its full effectiveness.
--124--
TABLE 9. Comparison of Hedgehog, depth charge, and Squid.
(On a per barrage basis.1)
| Period |
Nationality |
Depth
charge |
Hedgehog |
Squid |
| 1st half 1943 |
British |
5.4% |
--- |
--- |
| 2nd half 1943 |
British |
4.0% |
7.5% |
--- |
| 1st half 1944 |
British |
604% |
15.4% |
--- |
| 2nd half 1944 |
British |
5.1% |
28.1% |
18.2% (single)
33.3% (double) |
| 1st quarter 1945 |
British |
7.0% |
23% |
62% |
| Aug 1942 - June 1944 |
All Allied2 |
4.0% |
8.0% |
--- |
| May 1944 - May 1945 |
U.S. |
4.5% |
9.9% |
--- |
| 1. |
As mentioned in Section 11.3.1, British studies discard attacks not thought to be potentially effective and therefore give higher
figures than those based on all attacks including some on wakes, bubbles, etc. |
| 2. |
Based on only those incidents in which Hedgehog was used for at least one attack. |
In evaluating the depth charge versus Hedgehog comparison, it must be kept in mind that Hedgehog attacks may, on the whole, have been made by better
trained ships, in better sound conditions, or on shallower submarines, since Hedgehog is not to be used under unfavorable conditions. In the figures quoted
for August 1942 to June 1944, however, only depth charge attacks made in incidents which involved Hedgehog are counted.
In these cases the same ships are involved for both weapons and the general conditions of attack are the same. The superiority of Hedgehog is again
demonstrated, so that it may be concluded that the superiority is inherent in the weapon.
The figures on Squid success are based on a very small number of attacks and cannot be considered conclusive. They are, however, even better than the
theoretical predictions, as expressed in Table 4, confirming the high effectiveness expected of Squid.
As an overall conclusion on the relationship between theoretical and operational values for the effectiveness of various types of ordnance, one can
say that theory gives a correct picture of the relative merits of the various types and that it also gives a reasonably accurate picture of their absolute
values. In other words, theoretical studies provide a basis for evaluating the state of training of antisubmarine vessels by furnishing a standard to be
reached and also indicate the direction for most profitable development of antisubmarine ordnance.
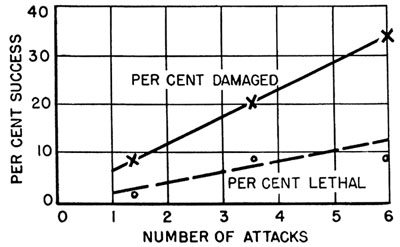 |
FIGURE 14. Success of incidents as a function of number of attacks (U. S. craft, January 1943-February 1944). |
It has been implied throughout that the probability of success in an incident is strongly influenced by the number of attacks made: the more attacks,
the greater the chances of sinking a submarine. Operational results prove that this is indeed the case. Figure 14 shows the relationship between success and
number of attacks. It is evident that the percentage of damaging incidents increases steadily as the number of attacks per incident increases, corresponding
to about 5 per cent damaged in each attack, which is in accordance with expectations. The percentage of lethal incidents also rises, a fact of considerable
importance. It might be expected that the mere existence of a fourth attack, for example, would mean that the previous three had not been lethal, and the
fraction of submarines sunk in cases where four attacks were made would simply measure the probability
TABLE 10. Coordinated versus independent attacks.
| |
Independent |
Coordinated |
| U.S. attacks, Atlantic and Mediterranean, Jan 1943 - Feb 1944 |
| Number of incidents (A-G, + JS1) |
176 |
18 |
| Number assessed A or B |
9 |
3 |
| Per cent successful |
5 |
17 |
| U.S. attacks, Atlantic and Mediterranean, March 1944 - May 1945 |
| Number of incidents (A-G, + JS1) |
41 |
38 |
| Number assessed A or B |
5 |
21 |
| Per cent successful |
12 |
55 |
| U.S. attacks, Pacific, December 1941 - April 1944 |
| Number of incidents (A-G, + JS1) |
181 |
29 |
| Number assessed A or B |
16 |
6 |
| Per cent successful |
9 |
21 |
| 1 |
Incidents are assessed JS when a submarine is believed to have been present but complete information on the incident was
not yet available at the time of study. |
--125--
of sinking in the fourth attack. Figure 14, indicates, however, that lethal damage may accumulate as a result of a succession of attacks. When a
number of attacks have been made, the next is more likely to prove lethal than it would otherwise. Figure 14 does more than
confirm the importance of persistence which was demonstrated by equation (5). This equation was based on the assumption that each attack had a fixed chance
of success, whereas the operational results suggest strongly that the chance gets better with each succeeding attack. It may be concluded that regaining
contact for persistent and repeated attacks is of the utmost importance.
Employment of several ships in coordinated hunt does much to assure that contact will be regained a large number of times, as shown in Table 5.
Correspondingly, coordinated incidents have a high probability of success. Some typical comparisons between independent and coordinated incidents are given
in Table 10. The coordinated incidents are consistently at least two or three times as effective as the independent.22
The overall conclusions concerning antisubmarine attacks are simple. For good effectiveness three things are required:
- Good attack accuracy through proper design of sound gear and ordnance and training of personnel.
- Good weapon effectiveness through a large commanded volume.
- Persistent and repeated attacks with good ability to hold and regain contact.
--126--
Table of Contents
Previous Chapter (10) * Next Chapter (12)
Footnotes
Transcribed and formatted for HTML by Rick Pitz for the HyperWar Foundation


