
Chapter 9
SAFETY OF INDEPENDENT SHIPPING
As was pointed out in Part I (page 2), the submarine's problem is one of first contacting a ship, then approaching to a good torpedo-firing position,
and finally securing a torpedo hit. It is appropriate to break down an analysis of measures designed to increase the safety of shipping into the same
general categories.
| 9.1 |
REDUCTION IN SUBMARINE'S ABILITY TO CONTACT SHIPS |
In the first place, anything which can be done to reduce the number of ships contacted by each submarine will increase the safety of the ships. Consider,
for example, a ship making a trip between two points through an ocean infested with submarines.
There are D submarines per sq mile in the ocean, each of which has a sweep rate of Q sq miles per hour7. The length of the ship's track is l miles and its
speed v. Then the expected number of times that submarines will contact the ship is
 |
Equation (1) |
To make No small, D, Q, or l/v must be decreased. These factors will be considered in turn.
| 9.1.1 |
Reduction in Submarine Density |
One method of reducing the submarine density to which the ship is exposed is to avoid regions in which submarines are concentrated. If it is possible
to choose between a route along which there are many submarines and one where there are few, the latter is certainly the better. When a fairly reliable
estimate of submarine positions is available, much can be done by evasive routing to reduce contacts, but such information is by no means always available.
If this information is not available, a wide dispersion of shipping routes can be employed, forcing the enemy to deploy his forces in the same way, instead
of permitting him to concentrate them against a well-defined shipping lane.
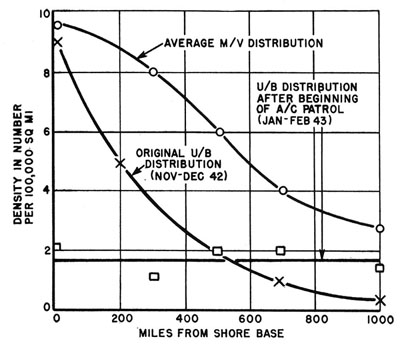 |
FIGURE 1. Effect of aircraft flying on the distribution of U-boats in Gibraltar-Morocco area. |
In an indirect way, offensive antisubmarine operations serve to reduce D, first, by sinking submarines and thus reducing their number at sea, and, second,
by preventing them from concentrating in the most profitable areas. Aircraft patrols frequently can be used to force U-boats out of the regions of the highest
concentration of ships. As an example of this process, a graph of U-boat density in the Gibraltar-Morocco region is shown in Figure 1.
Immediately after the Allied landings in North Africa, the U-boats were concentrated close to shore in the region of highest density of merchant ships.
Almost immediately, however, aircraft patrol forced them to give up the inshore concentration, which had, no doubt, resulted from a special effort to break
up the invasion. The effect of this change in U-boat distribution on their expected number of contacts on ships can be estimated very simply. In any particular
region, the expected number of contacts is
 |
Equation (2) |
where A = area of region, DU/B = density of U-boats, and DM/V = density of merchant vessels. This expected number
must be calculated separately for
--93--
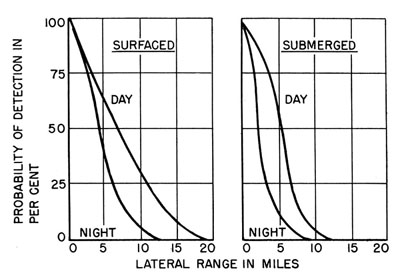 |
FIGURE 2. Lateral range curves, submarine detection of merchant ships. |
each region and summed. If this is done and a value for Q of 100 sq miles per hour is taken as typical of a Submarine search rate for merchant ships,
then we would expect about 60 contacts per month by U-boats on merchant ships before flying had forced them out, and 30 contacts per month afterwards.
It would be reasonable to conclude that the flying involved8 had
cut the danger to ships approximately in half.
| 9.1.2 |
Reduction in Submarine Sweep Rate |
To some extent, aircraft patrol may fail to drive U-boats out of an area as described above and merely force them to spend most of their time submerged.
This also serves to make ships safer because it reduces the submarine's sweep rate. The primary reason for the reduction is the decrease in the range of
detection, though the drop in submarine speed also has some effect. The submerged submarine is relatively blind compared with a surfaced one, since visual
detection must be through periscope and also since radar cannot be used very conveniently.
Operational data on the magnitude of these effects can be derived from the first contact ranges reported by U. S. submarines. From these data the lateral
range curves of Figure 2 are plotted. The assumption has been made that there is a definite range at which contact will be made for each time that a submarine
meets a ship, though these ranges vary widely front one occasion to the next9.
The area under these curves gives s the sweep width, the values being as given in Table 1.
TABLE 1. Submarine sweep width in searching for merchant ships.
| |
Day |
Night |
Average |
| Surfaced (miles) |
14.5 |
9.4 |
12 |
| Submerged (miles) |
9.8 |
4.2 |
7 |
The overall effect of forcing the submarine to submerge appears to be a reduction of 40 per cent or so in the sweep width. We can, then, consider half
the sweep width to be the effective range of contact, which would be 6 miles surfaced and 3.5 miles submerged. If submarines remained fixed in the ocean,
there would be a proportional reduction in the number of ships contacted by the submarine, but since the surfaced submarine is able to add something to its
search capabilities by patrolling at about 10 knots, the speed effect must also he taken into account, though it proves to be rather small.
This speed effect is treated in Chapter 1 of Volume 2B, Search and Screening. The result is expressed in equation (5) of that chapter, which allows us to
write the search rate Q of equation (1) explicitly as
 |
Equation (3) |
where
Q = sweep rate,
No = expected number of contacts per unit time,
N = Number of ships per square mile,
R = effective range of contact,
u = submarine speed,
v = merchant vessel speed.
From equation (3) we can calculate Q, using tables to determine values of the elliptic integral involved. With the assumption that the merchant ships
involved make 10 knots, the surfaced submarine 10 knots, and the submerged submarine 3 knots, the results are as presented in Table 2.
The net conclusion is, therefore, that a submerged submarine has been able to contact only about half as many ships as a surfaced submarine and that
anti-submarine patrol which forces submarines to submerge
--94--
TABLE 2. Sweep rate of submarine in contacting merchant ships
| |
Submarine
Speed |
Range of
Contact
(R) |
Sweep Rate
(Q) |
| Surfaced |
10 kt |
6 miles |
150 sq mi/hr |
| Submerged |
3 kt |
3.5 miles |
70 sq mi/hr |
most of the time has an appreciable effect in reducing contacts.
Another line along which effort might reasonably be expended to reduce the submarine's contact rate is camouflage. Since, however, it is by no
means easy to devise a camouflage which is effective in this sense under all the varied conditions met with in practice, relatively little has been
done, and operational data on the subject arc not available.
| 9.1.3 |
Reduction in Ship's Time at Sea |
The factor l/v in equation (1) is simply the time the ship spends in the dangerous region. To keep this time small, the track length l should be made
as short as possible and high ship speed used. The advantages of high ship speed in this connection are offset, however, by an increase in Q with ship speed.
The most important consideration is length of ship's track in dangerous waters.
| 9.2 |
REDUCTION IN SUBMARINE'S ABILITY TO APPROACH SHIPS |
When the submarine has made a contact, it must still make an approach to torpedo-firing position before launching an attack, and it is by no means
certain that it will be able to do so. In a typical period only 41 per cent of the independent merchant vessels contacted by United States submarines
were attacked. Some of the remaining 59 per cent were not worth attacking, but many were not attacked because the submarine was unable to close to the
desired position for launching a torpedo. The quantitative importance of the approach problem is made more evident by an analysis of the effect of
merchant vessel speed on the safety of independent ships, based on Allied losses to German U-boats.
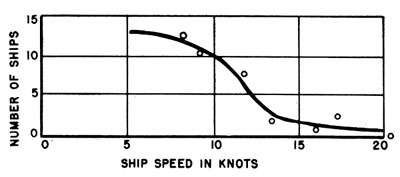 |
FIGURE 3. Ships sunk per million miles of track in a U-boat density of 1 per million
square miles, as a function of ship speed. |
| 9.2.1 |
The Effect of Ship Speed on Submarine Approach |
In order to study the effect of speed, it is necessary to assign the ships to speed classes and then determine the number of ships sunk in each
class and the overall exposure of each class to submarines. This overall exposure must take into account both the total distance traveled by ships
of each class and the density of U-boats along the ships' courses, as indicated by equation (1).
In order to do this a study was made in which the Atlantic was separated into areas. In each area the mileage traveled by independents of different
speed classes and the average density of U-boats were taken month by month. A ship which sails 2000 miles in waters with one U-boat per million sq
miles is exposed to about the same risk as one traveling 1000 miles in waters with two U-boats per million sq miles. Hence, the exposure for each speed
class is given by the product of the mileage and the U-boat density. This was done for seven speed classes, covering a period of 4 months and four areas.
The number of casualties per unit of exposure is a measure of the safety of the speed class in question, and this is plotted in Figure 3
as a function of speed. The sharp decrease in sinkings at speeds between 10 and 15 knots is very obvious. In order to explain this result the following analysis of
submarine approach methods is required.
If a ship is sighted in a favorable position, the U-boat may approach either surfaced or submerged and attack directly. If the U-boat is not in a
favorable position, it has to estimate course and speed and follow the ship until it can close the range or get into position ahead for a submerged
approach. The direct attack may be called Method A, the attack following a chase, Method B. Since Method B provides a good opportunity for tracking
and obtaining torpedo-firing data, it is frequently used, a typical procedure being to track until dark and then attack.
--95--
Method B requires that the U-boat be able to overtake the ship, namely, that the ship speed be not greater than about 15 knots (14 knots appears to
be the critical speed in Figure 3). Method A, on the other hand, may be used against ships of any speed, though the number of times
the U-boat is in favorable position will decrease as the speed of the ship increases. This decrease certainly does not account for the sharp rise in the
curve of Figure 3, which is due to the advent of attacks made by Method B. A diagram is helpful in making clear the significance of these two methods.
In Figure 4, the submerged approach zone and effective contact range arc plotted. The shaded area drawn to 2000 yd on either side
of the ship is taken as a rough approximation to the zone in which a submarine has a good chance of scoring a torpedo hit. Suppose that a submarine which makes
contact while ahead of the ship in the submerged approach zone can make an attack by Method A with average chance of success k. Then the crosshatched line gives
the sweep width for Method A attacks. For a very fast ship, the sweep width is approximately 2 miles, and increases to about 12 miles for very slow ships as the
limiting approach angle increases. Then the expected number of Method A attacks per million miles of track in a U-boat density of one per million square
miles is given by the length of this line and the expected number of sinkings is k times as great.
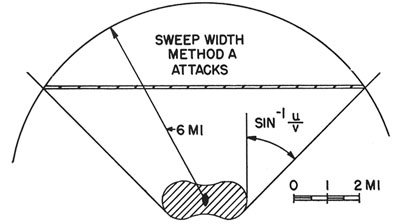 |
FIGURE 4. Submarine approach zone. |
Assuming that submarine speed (under water) = 5 knots and that k= 0.20, the dotted line in Figure 5 is a rough graph of expected sinkings by Method A.
For ships of speeds of 15 knots or greater, all observed sinkings are accounted for, but many additional ships of speeds less than 15 knots were sunk,
presumably by Method B. Either the submarine is enabled to track the ship and wait for a very favorable opportunity to attack or is able to try again after
a failure, in order to attain a high eventual level of success.
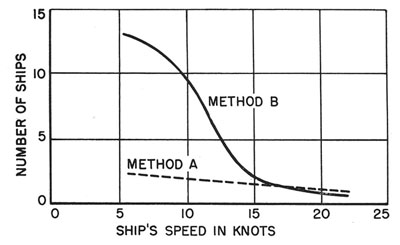 |
FIGURE 5. Ships sunk per million miles of track in a U-boat density of 1 per million sq miles. |
For purposes of comparison, calculate the number of ships that would be sunk if every ship contacted by U-boats were sunk, using equation (1). If we
take the example previously discussed, a 10-knot ship and assume that the U-boats are surfaced, then conditions corresponding to Figure 5 are
D = 1/1,000,000
l = 1,000,000
v = 10
Q = 150.
We have
N = 1 / 1,000,000 x 150 x 1,000,000 / 10
= 15 ships contacted per million miles of track.
Thus we would expect 15 ships to be contacted, whereas Figure 5 shows 10 sunk under these conditions. This seems like a rather high percentage, but it
should be remembered that the conditions are on the whole rather favorable to the U-boat - a slow ship, unescorted, with little or no air patrol. A faster
ship would be very considerably safer, though the number of times it is contacted per mile of track would not be greatly different.
To summarize, then, there are three important speed classes.
- High-speed ships - sufficiently fast that the submarine cannot track or overtake them. The sinkings are low and not greatly dependent upon speed,
though the additional speed of the ship clearly makes the submarine's problem increasingly difficult.
- Low-speed ships - so slow that the submarine can track and overtake without difficulty. Sinkings are approximately ten times as great as in the high speed case and
are not critically dependent on speed.
- Intermediate-speed ships - for which there is an abrupt transition from the conditions of class 2 to class 1 and whose losses depend strongly on speed.
--96--
TABLE 3. Independent merchant vessel losses. Caribbean Sea Frontier
(July 1942 - Feb 1943).
| Month |
Average
No. of
U-boats |
Average
No. of
independent
M/V |
Independent
M/V sunk |
U-boat
sinking
rate |
Flying
hr from
Trinidad |
July 1942
Aug |
Sept
Oct |
Nov
Dec |
Jan 1943
Feb |
|
5.1
6.4 |
9.0
8.6 |
5.1
4.0 |
3.0
1.8 |
|
11.7
12.6 |
11.7
11.4 |
13.6
11.1 |
11.1
10.0 |
|
|
210
60 |
}140 |
140
80 |
}115 |
105
90 |
}100 |
0
0 |
}0 |
|
---
2,400 |
5,000
5,000 |
4,700
4,400 |
5,100
5,000 |
|
The critical speed is one approximately equal to the surfaced speed of the submarine. A change in submarine speed would result in a corresponding change
in the curves of Figures 4 and 5. With the U-boat capabilities of World War II, the critical importance of speed in the 10- to 14-knot range is obvious. Any
measure, such as frequent dry-docking to clean the bottom, which might give an extra knot or two of speed in this range would be well worth while for a ship
destined to sail independently through submarine waters.
| 9.2.2 |
The Effect of Aircraft Patrol on Submarine Approach |
The important role played by surfaced pursuit and tracking on the part of the submarine makes it evident that any measure which keeps the submarine submerged
a considerable part of the time will greatly reduce its chance of converting a contact into a sinking. Consequently, aircraft patrol, which tends to force the
submarine down, might be expected to eliminate Method B attacks and greatly increase the safety of independent ships. The reduction in sinking rate indicated for
10-knot ships by Figure 5 is 83 per cent; that is, about one-sixth as many ships would be lost as when surfaced tracking was possible.
Operational data showing a clear comparison between surfaced and submerged operation are difficult to obtain without great differences in time and place. In
addition, the advent of aircraft flying is normally accompanied by the start of convoying, and the effects of each are difficult to distinguish. For example,
the start of convoying would normally increase the average speed of independent ships since the slow ships would be put in convoy. As a result, independent
ships would appear to become safer. The type of result which may be obtained is shown in Table 3, which presents data from the Caribbean Sea Frontier during
the fall of 1942. The area considered includes the first 120 miles from shore in the Caribbean Sea Frontier-West and involves primarily action in the vicinity
of Trinidad. As a rough measure of the aircraft flying involved, data on flying in the Trinidad sector are used. The U-boat sinking rate (in sq miles per hour)
is given by the following equation.
 |
Equation (4) |
In this case the area involved is about 600,000 sq miles.
From a consideration of the first and last 2-month periods, it is apparent that an increase in flying has taken place, accompanied by a decrease in the
sinking rate. But it is not evident whether the former was indeed the cause of the latter, and, if so, whether the Method A and Method B considerations
involved had anything to do with it. When the sinking rate and flying are plotted graphically as in Figure 6, it appears that there was a lag of several
months between the rise in the flying curve and the decrease in sinking rate. At the time the increase in flying was
--97--
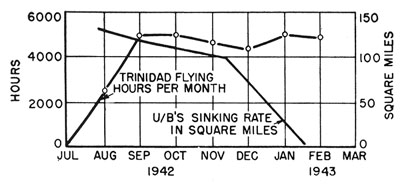 |
FIGURE 6. Sinking rate and flying, by months (Caribbean Sea Frontier, West). |
made, the U-boat sinking rate dropped only slightly. This suggests that the flying did not cause the drop in sinking rate directly, but that the
increased antisubmarine effort eventually (about January 1943) caused the U-boats to abandon their offensive in that area and adopt more conservative
tactics. As is evident from Table 3, they actually started to withdraw from the area in November and were practically all gone by February. The drop
in sinking rate probably means that the few remaining made much less of an effort to attack ships than they had done some months before, rather than
that aircraft flying directly prevented them from attacking by keeping them submerged.
The flying was not, in fact, sufficient to do so, as can be seen from an elementary calculation in which we estimate the amount of flying that would
be required to prevent surfaced tracking by submarines.
If for example, it is assumed that to deny a submarine surfaced operation it must see a plane and be forced to dive at least twice a day, the number
of flying hours required to produce this effect can be calculated. A sort of sweep rate can be assigned to the aircraft by supposing that all submarines
within 5 miles of the track are forced to dive, and no others (probably a rather generous figure). Then the aircraft must cover the area involved 60 times
during the month, a total of 60 x 600,000 = 36,000,000 sq miles covered. But the aircraft's sweep rate is 2 x 5 x 125 sq miles per hour, assuming an
aircraft speed of 125 knots. Hence, the total number of flying hours required is
 |
Equation (5) |
The actual flying recorded is not, strictly, the total amount in the area under consideration, but the total from Trinidad. Some of it was outside the
area, and some other flying was done in the area. Nevertheless, the total flying in the area considered was certainly a good deal less than 29,000 hours per
month and could not be expected to eliminate surfaced operation of U-boats.
Sufficient flying to eliminate surfaced operation can ordinarily be accomplished only in a very limited area. In the vicinity of the British Isles, however,
such a situation existed during the last months of World War II. U-boats operated totally submerged, using Schnorchel in the most heavily patrolled inshore
waters. In view of the densities of U-boats and ships involved, however, they did not make very many sinkings. Many factors besides aircraft patrol were
important, and a detailed analysis of the situation would be extremely complicated. It is mentioned merely as evidence that submarines may at times go to
the extreme of totally submerged operation.
| 9.2.3 |
Effect of Zigzag on Submarine Approach |
With respect to the submarine's approach problem the importance of high ship speed and of aircraft patrol to enforce submerged operation have been
discussed. Both of these are effective antisubmarine measures in that they make it difficult for the submarine to carry out an approach to the ship.
Another measure with the same aim is worth considering: the zigzag. By making fairly radical turns at irregular intervals, the ships can make it more
difficult for the submarine to approach to a good firing position and to secure good torpedo-firing data. The net result is that the submarine will tend
to be forced to fire from a poorer position with poorer accuracy and will therefore have less chance of securing a hit. At present, however, quantitative
data on the effect of zigzagging arc not available.
| 9.3 |
REDUCTION IN EFFECTIVENESS OF TORPEDO FIRE |
Once the submarine has reached position and fired its torpedoes, there are still certain defensive measures which can be taken to reduce sinkings.
Torpedo detectors have been devised to warn of the torpedo's approach, thus permitting a turn to avoid it, but they have not been effective on merchant
ships. Ships should be built so as to be as likely as possible to stay afloat when hit. Special protective devices
--98--
such as anti-torpedo nets may be employed. Because of their extensive use, operational data on their effectiveness are of considerable interest.
To January 1, 1944, 25 ships fitted with Admiralty Net Defense [AND] nets were reported to have been torpedoed, with the results given in Table 4.
TABLE 4. Results of torpedoes fired at ships fitted with antitorpedo nets.
| |
Sunk |
Damaged |
Undamaged |
| Nets not in use when attacked |
9 |
3 |
0 |
| Nets in use |
4 |
3 |
3 |
| Use of nets unknown |
3 |
0 |
0 |
Of the ships not using nets, 75 per cent of those fired at were sunk, but with nets streamed only 40 per cent fired at were lost. The chance of being
sunk is still about half what it would be without nets, because some torpedoes either go through the nets or hit at unprotected ends of the ship. Table 4
above also indicates that about half the torpedoings occurred when nets were not streamed, so that the ultimate effect is that ships fitted with nets suffer
about three-quarters the losses that they would sustain without the nets.
These are the overall results, of course, and depend on the manner in which the nets are used. In the period considered, many of the ships were in convoy
and streamed nets only when attack was considered likely. Bad weather is also a cause for nonstreaming of nets. This factor enters into the overall usefulness
of nets.
A serious drawback of net defense is the attendant reduction in speed when nets are streamed. This amounts to about 17 per cent. For a 14-knot ship, the
reduction in speed to 11½ knots increases the danger to the ship by a factor of about 3½, if the ship is sailing independently, according to Figure 3.
This increase more than overbalances the 50 per cent reduction afforded by the nets; consequently, their use would not be desirable in this case. If, however,
the original speed were only 10 knots, reduction to 8 knots would not seriously increase the danger, and nets would be most desirable for use in submarine waters.
To summarize, then, there are a number of defensive measures which may be taken to reduce sinkings of independent ships. Most of them are effective
because they make it more difficult for the submarine to carry out its approach and attack. The overall effectiveness of these measures is limited, however,
and the most successful defensive measure has been the use of escorted convoys, which will now be discussed.
--99--
Table of Contents
Part II * Next Chapter (10)
Footnotes
Transcribed and formatted for HTML by Rick Pitz for the HyperWar Foundation


