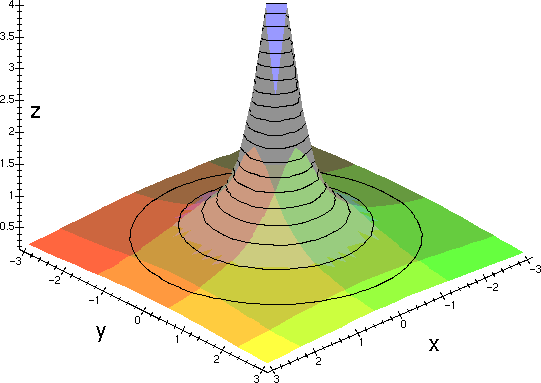

The plot is a hyperbola in the xz-plane, rotated around the z-axis. Note that although it is not explicitly shown, the upward-reaching point of the plot is to be taken reaching to infinity. The black circular lines you see are equipotential lines. They connect points of equal potential on the graph.
The colors are for illustration only - they have no physical meaning.