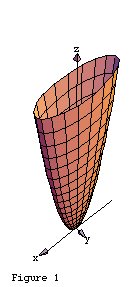
For example:
is the equation of the elliptic paraboloid sketched in Figure 1.

Shown in Figure 2 is a family of level curves where takes on values in the range of .

These ellipses constitute a contour map of the function. A specific ellipse in the family is shown in red in Figure 2.
Applications of level curves and contour maps
If the xy-plane represents sea level and represents the height above and the height below sea level, then a contour map of a surface is a topographic map of the terrain. If the xy-plane represents the base of a hill, with x the longitude, y the latitude, and z the altitude or elevation of a point, then again a contour map is a topographic map.In general, a contour map indicates the variation of z with x and y. It is customary in a topographic map to take constant intervals between level curves, e.g., a difference of 1000 meters in altitude. Thus, when the level curves are close together, the value of the function (e.g., the altitude or elevation) is changing more rapidly than when the level curves are further apart. In other words, when the level curves are closer, the surface is steeper than when the level curves are further apart. Thus, a general idea of the steepness of a terrain can be obtained from a contour or topographic map of the terrain.
Suppose the temperature (say in degrees Celsius) of any point on a flat metal plate is given by a function . Then the level curves of the function have the form , where takes on values in the range of . These curves are called isotherms, since the temperature is the same on a given level curve.
If is the electric potential at any point (x,y) in the xy-plane, then the level curves have the form , where takes on values in the range of . These curves are called equipotentials, since the electric potential is the same along a given level curve.
In the case of a weather map, the function may represent atmospheric pressure. In this case, the level curves are called isobars because along any one of them the pressure is constant.
Any curve satisfying the equation where is constant, may be regarded as the level curve of a suitable function such that is in the range of .