
CHAPTER II
Theory of Radar
A. Principle of operation.
B. Functional components: Timer; transmitter; antenna system; receiver; indicator; power supply.
C. Cathode-ray tube: General; electron beam; fluorescent screen; electrostatic cathode-ray tube; electromagnetic cathode-ray tube.
D. Determination of range: Time-range relationship; time measurement.
E. Determination of bearing: Antenna pattern; single-lobe system; double-lobe system.
F. Determination of altitude: Vertical antenna pattern: estimation from fade chart; measurement of position angle.
G. Types of data presentation: General; deflection presentations: intensity-modulated presentations. |
A. PRINCIPLE OF OPERATION
Radar is an application of radio principles by means of which it is possible to detect the presence of objects, to determine their direction and range, and to recognize their character.
Detection of targets is accomplished by sending out radio waves in a series of pulses from a high-power, ultra-high-frequency radio transmitter. A directional antenna confines these pulses into a beam which is directed over the region to be searched. When the pulse strikes an object in its path, energy is reflected. Some of this echo energy is returned toward the radar, but only a very small portion is intercepted by the antenna. A sensitive receiver connected to the antenna can detect the echo and, therefore, indicate the presence of the object, or target. The determination of the actual range and direction is based on the facts that radio waves travel at the constant velocity of light and that the receiving system can be directional.
B. FUNCTIONAL COMPONENTS
Radar systems now in existence vary greatly as to detail. They may be very simple or, if very accurate data are required, they may be highly complicated. The principles of operation, however, are essentially the same for all systems. Thus a single basic radar system can be visualized in which the functional requirements hold equally well for all specific equipments. In general, the degree of refinement of the circuits used increases with the frequency, since the microwave region lends itself to a higher degree of precision in angular measurement.
The functional breakdown of a radar system resolves itself into six essential components. These are shown in figure 3 and may be summarized as follows:
-
The timer (known also as the synchronizer or modulation generator) supplies the synchronizing signals which time the transmitted pulses and the indicator, and which coordinate other associated circuits.
-
The transmitter generates the radio-frequency energy in the form of short, powerful pulses.
-
The antenna system takes the radio-frequency energy from the transmitter, radiates it in a highly directional beam, receives any returning echoes, and passes these echoes to the receiver.
-
The receiver amplifies the weak radio-frequency pulses returned by the target and reproduces them as video pulses to be applied to the indicator.
-
The indicator produces a visual indication of the echo pulses in a manner which presents the desired information.
-
The power-supply furnishes all a-c and d-c voltages necessary for the operation of the system components.
C. CATHODE-RAY TUBES
1. General.
The cathode-ray tube is a special type of vacuum tube in which electrons emitted from a cathode are accelerated to a very high velocity, are formed into a narrow beam, and are finally allowed to strike a chemically prepared screen which fluoresces, or glows, at the point where the electrons strike. The importance of the cathode-ray tube is that it provides a visual means of displaying and measuring electrical
--7--
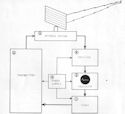
Figure 3--Functional block diagram of radar system.
phenomena. The electron beam can be deflected extremely rapidly because the electrons are so very light in weight that the beam has almost no inertia. This property permits the use of the cathode-ray tube as an instrument for measuring currents and voltages in terms of fractional parts of a microsecond.
The chief use of the cathode-ray tube in radar is as a visual indicating device on which is displayed the information obtained by the radar system. Another important use of this tube is in a test instrument known as an oscilloscope, which permits the examination of all types of electrical waveforms. Since the oscilloscope was in use long before a cathode-ray tube was used as a radar indicator, the name has carried over to the extent that the radar indicator screen is usually called the "scope."
2. Electron Beam.
Electrons are small, negatively charged particles of matter that have negligible weight or mass. All electrons carry the same amount of negative charge and this charge cannot be neutralized or removed.
When a free electron is allowed to enter the space that separates two pieces of metal between which a voltage difference exists, the electron will be attracted toward the positive plate. Thus the stream of electrons that flows in a cathode-ray tube can be moved about by the application of voltages to the deflecting plates in the tube, in much the same way that a stream of water can be moved about by deflecting the nozzle that guides the water. The type of cathode-ray tube in which this sort of control is used is called an electrostatic tube.
--8--
In another type of cathode-ray tube, called an electromagnetic tube, the electron beam is controlled by means of magnetic fields. This control is possible because the moving electrons in the beam constitute an electric current. With every electric current there is associated a magnetic field that is capable of interacting with another magnetic field. This interaction produces a force that deflects the electron stream from its normal straight path.

Figure A--Parts of a cathode-ray tube.
A simplified cathode-ray tube is shown in figure 4A. In this case, the electrons are emitted from the heated cathode, and they proceed in a straight line under the attraction of the accelerating anode. Depending on the strength of this attraction, the velocity of the
electrons may reach 10,000 miles per second. Many of the electrons strike the anode and are eliminated, but some of them pass through the small hole in the anode and continue beyond to the screen. However, such a simple arrangement is not able to produce a well-defined spot on the screen. Therefore, cathode-ray tubes which are now in use employ a rather complicated assembly of parts, called an electron gun, to produce a sharply focused spot of light (figure 4B). The functions of the electron gun can be explained by comparing it with the optical system shown in figure 5A. A simplified drawing of the electron gun proper is shown in figure 5B. To clarify the analogy between the two drawings, similar parts are labelled with the same letters. The light bulb produces rays which can be formed into a narrow beam and focused to a small bright spot on the screen. The cathode and heater in the vacuum tube produce electrons instead of visible light. A condensing lens at B focuses the light rays to a point at X, the crossover, and the aperture C controls the intensity of the light in the beam. In the cathode-ray tube the control grid exerts similar effects on the electrons. The voltage difference between the grid and cathode produces electric lines of force that act on the electrons in a way that causes them all to pass through the crossover point at X. In both the optical and electron systems the function of the remaining elements is to focus an image of the point X on the screen at G. In the cathode-ray tube the two anodes form an electron lens which serves this purpose. The focus of the spot on the screen in the optical system can be controlled by moving the lenses E and F along the axis of the system. However, it is not practical to move the electrodes within the evacuated cathode-ray tube to focus the electron beam. Therefore, the effective position of the electron lens is varied by changing the voltage applied to the focusing anode at D.
3. Fluorescent Screens.
The fast-moving electrons that flow in the cathode-ray tube possess kinetic energy because of their motion. In order to convert some of this kinetic energy into visible light on the screen, the inside of the tube is coated with a chemical which has the property of emitting light when bombarded with electrons. This property is known as fluorescence. Continued emission of light after the bombardment has ceased is called phosphorescence.
All fluorescent materials phosphoresce to some extent, but the duration of this afterglow varies with the material used on the screen. The length of time that the spot will remain visible on the screen, which is called persistence, is therefore dependent on the type of fluorescent coating used in the tube. In some cases, short persistence is desired because the screen must show fast variations in signals clearly without the blurring that long afterglow would cause.
--9--
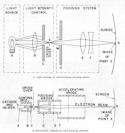
Figure 5--Focus of electron beam.
However, in many radar indicators the signals are retraced at relatively long intervals. In such cases the screen must be of long persistence so that the pattern fades out slowly, leaving it visible on the screen.
The type of screen material used determines the color of the light emitted. Common colors that are available are green, yellow, blue and white. The screens of short persistent tubes usually are coated with a single chemical layer, but the long persistent tubes often have two distinct chemical coatings on their screens. Usually one layer emits very bright blue light when the electrons strike and this blue light causes the second layer to emit yellow light for several seconds after the electron bombardment is over.
The intensity or brightness of the spot of light that appears on the screen is dependent on the amount of energy that the electrons deliver when they strike. In a given tube, the intensity is controlled by the number of electrons that flow in the beam, which in turn is controlled by the voltage applied to the grid in the electron gun. If desired, the voltage on the grid canbe varied so that no electrons can flow, and the screen will be blank. Varying the grid voltage, then, controls the flow of electrons and therefore the intensity of the spot, just as a valve in a pipeline can turn off and on the flow of water.
4. Electrostatic Cathode-Ray Tube.
The electron beam in an electrostatic cathode-ray tube is formed by an electron gun like that shown in figure 4B. It would be very desirable if the only voltage within this gun that affected the focus of the spot were that applied to the focusing anode, but the nature of the electron lens is such that its operation is affected by all the voltages in the tube. Thus, if the grid voltage is changed to vary the intensity of the spot, the position of the crossover point is slightly displaced. In order to compensate for this change, the focus control must be readjusted. The two controls on the cathode-ray tube, then, are not independent. Bset definition can be obtained only by adjusting both the focus and intensity controls alternately. This is
--10--

Figure 6--Deflection of electron beam
not a difficult operation, but it does complicate the apparatus needed to provide large sudden changes in the brightness of the spot on the screen.
If there were no electrodes in the cathode-ray tube beyond the electron gun, the beam would proceed straight toward the screen and would make a single bright spot in its center. The usefulness of the cathode-ray tube lies in the fact that the beam can be deflected to any part of the screen. The deflection is caused by the voltages applied to the deflection plates shown in figure 6. One pair of these plates controls motion in the horizontal direction and the other controls motion in the vertical. Combinations of voltages applied to these two pairs of plates can produce patterns of all sorts--even a picture when the tube is used as a kinescope in a television receiver.
The human eye retains an image for about 1/16 second after viewing. Motion pictures make use of this characteristic of the human eye in creating the illusion of motion by a series of still pictures flashed on the screen so rapidly that the eye cannot follow them as separate pictures. In a cathode-ray tube the spot can be moved so quickly that a series of adjacent spots can be made to appear as a line, if the beam is swept over the same path fast enough. As long as the electron beam strikes in a given place at least 16
times a second, the spot will appear to the human eye as a source of continuous light, but the light will flicker. If each spot is illuminated more often than about 40 times per second, even the flicker will not be apparent, and a uniform luminous line will show on the screen.
5. Electromagnetic Cathode-Ray Tube.
The electron gun in the electromagnetic cathode-ray tube is somewhat different than that in an electrostatic tube. The difference lies in the use of a steady magnetic field as an electron lens instead of the charged electrodes. (See fig. 7.) Control of the brightness of the spot is the same in both types of tubes. An advantage that results from magnetic focusing is that the brightness and focus are much less interdependent than in the electrostatic tube. It is primarily for this reason that the designers sometimes use electromagnetic tubes and sometimes electrostatic, depending on the type of pattern which it is desired to produce on the screen.
However, even in the electromagnetic tube too great a change in grid voltage will affect the focus. If too strong a signal is applied to the grid, the spot becomes very bright and badly defocused. This phenomenon has been termed "blooming" since maladjustment of

Figure 7--Electromagnetic cathode-ray tube.
--11--
this sort causes the normally small spot to bloom into a large blob. The circuits of radar indicators usually are designed to minimize this undesirable effect.
In an electromagnetic tube the beam is deflected by a varying magnetic field. In many cases the deflecting coils are mounted in a yoke that can rotate around the neck of the tube, which is of advantage when a rotating radial sweep is desired.
D. DETERMINATION OF RANGE
1. Time-Range Relationship.
A radar pulse, once it has been radiated into space, continues to travel at a constant velocity. When it strikes a reflecting object, there is no loss in time, but only a re-directing of the energy. Its velocity is that of light, which is approximately 162,000 nautical
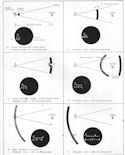
Figure 8--Principle of echo ranging.
--12--
miles per second or, more accurately, 328 yards per microsecond.
The constant velocity of propagation of the radio frequency energy is used in radar to determine range by measuring the time required for a pulse to travel to the target and to return. For example, assume that a pulse of one microsecond duration is transmitted toward an airplane which is 32,800 yards away. In figure 8A the pulse is shown as it just starts from the radar antenna toward the target. The pulse is midway between the radar and the plane in B, and in C it has traversed the 32,800 yard distance at a speed of 328 yards per microsecond. Therefore, 100 microseconds have elapsed. As soon as the leading edge of the pulse strikes the plane a small part of the energy is reflected. Since the transmitted pulse is one microsecond in duration, the reflected pulse is also one microsecond in duration because energy is reflected from the plane continually during the one microsecond interval in which the transmitted energy strikes the plane. In D the echo pulse is shown returning toward the radar while the transmitted pulse continues beyond the target. The time required for the echo to travel from the plane to the radar is 100 microseconds, since the return trip is also 32,800 yards long. Figure 8E shows the echo pulse returned to the radar system. The total elapsed time is 200 microseconds for a distance traveled of twice the actual range of the target. For radar ranging, therefore, the velocity of propagation of r-f energy may be considered to be one-half of the velocity of light, or 164 yards per microsecond. In the example of figure 8,
Range = 164 × time, or
Range = 164 yards/μsec × 200 μsec = 32,800 yards
2. Time Measurement.
In order to employ this time-range relationship, the radar must have a time-measuring device. In addition, since there may be more than one target in the region under search, some means of separating the echo signals must be included. The cathode-ray tube is well suited to such a task, since the information can be displayed visually on a time scale which can be produced readily on the face of the tube.
As an example of the measurement of time with a cathode-ray tube assume that a horizontal linear sweep is used to move the beam across the screen at a velocity of 1 inch per 100 microseconds. The echo signals received from a target at a range of 32,800 yards are applied to the tube to cause vertical deflection of the beam. The appearance of the cathode-ray tube at several instants is shown in figure 8. In A the trace have moved 0.01 inch across the screen, and the transmitted pulse has just left the antenna. The transmitted pulse is shown on the screen as a vertical deflection
since a small part of the transmitted energy leaks directly into the receiver. After 100 microseconds have elapsed, the pulse reaches the target 32,800 yards away, and the spot has moved 1 inch across the screen (fig. 8C.). Since the radio-frequency energy is out at the target, there is no vertical deflection of the trace at this instant. The reflected pulse returns to the radar antenna at the end of 200 microseconds, during which the sweep trace has moved a total distance of 2 inches. For the duration of the received pulse, one microsecond, the trace is deflected vertically (fig. 8E) and the indication of the target appears as a vertical deflection two inches from the start of the trace. Thus, with a constant sweep velocity of 1 inch per 100 microseconds, a time scale is produced which is equivalent to 100 μsec × 164 yards per μsec = 16,400 yards per inch of trace. As a result, the range of any echo that appears on this time base can be scaled off directly in yards without the necessity of first measuring the time, and then converting to range.
The single trace illustration used will not persist on the cathode-ray tube screen long enough to be useful. Therefore, it is necessary to repeat the sweep and pulse transmission periodically. If the two operations are always made to start in the same time relation, the signals returned from a given target will be superimposed on successive traces, so that a steady bright line will be visible on the screen.
E. DETERMINATION OF BEARING
1. Antenna Pattern.
Radar antennas are made directional in order to produce a single narrow beam in one direction. This narrow beam, or lobe, permits maximum energy to be sent in any desired direction. A plot of the signal strength at a given point versus the angular position of the radar antenna is called the radiation pattern of the antenna. In addition to transmitting maximum energy in a desired direction, a directional antenna also receives energy most effectively from that same direction. To obtain an approximate pattern of an antenna, the amplitude of the echo signal from a fixed target can be plotted versus the angular position of the antenna.
2. Single-Lobe System.
The antennas of most radars are designed so that they radiate energy in one lobe that can be moved only by moving the whole antenna. The general shape of such a single lobe is shown in figure 9. The teardrop outline illustrated may be said to represent a polar plot of echo amplitude versus bearing. Thus, for a particular target at a particular range, the echo amplitude at any bearing relative to the lobe axis may be found by drawing a line along that bearing from the antenna position at point A. The length of the
--13--
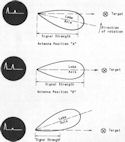
Figure 9--Relationship between lobe axis and target bearing.
line between A and the intersection with the lobe outline indicates echo amplitude. For other targets and targets at different ranges, other lobe contours must be drawn if echo amplitude is to be represented. However, all these lobes are similar in shape, so that they would form a family of curves like the striations on an oyster or clam shell.
As the antenna rotates, then, the echo signal varies in amplitude. At antenna position A or C the echo is relatively small, but at position B, where the lobe axis is pointed directly at the target, the echo is maximum. The bearing of the target can be obtained by training the antenna to the position in which the echo size is greatest.
3. Double-Lobe System.
The shape of an antenna lobe is such that the echo signal strength varies more rapidly with change of bearing on the sides of the lobe than near the axis. One common system of using this rapid variation of signal strength employs an antenna capable of producing two identical lobes whose axes are displaced by some angular distance (fig. 10). The two lobes intersect at only one point, known as the crossover point, at which each lobe receives equal echo signals from a target on the line of bearing through the crossover point.
When the target is in position A, the echo signal strength received by lobe 1 is proportional to Y, and that received by lobe 2 is proportional to ×. The indicator used with this type of system shows the echoes from the two lobes separately. Thus, when the target is at A the right-hand pip is smaller than the left, so that the operator knows to train left to bring the antenna axis on target. If the antenna were rotated so that the target is in position B, the signals received by the two lobes are reversed, and the indicator appearance is therefore reversed too. At position C, the signals received by the two lobes are equal and proportional to Z. The fact that the two pips on the indicator are of the same height is an indication that the antenna axis is on the bearing of the target.
The use of two lobes instead of a single lobe greatly increases the precision of bearing measurement because the operator has a more sensitive indicator to show whether he is off target or not. In addition to the increased accuracy possible with this system, it has the advantage of providing the operator with a sense of direction. If the antenna is off target to the right, as at A in figure 10, the inequality of the pips on the scope shows the direction to train to get back on, and the amount of inequality in echo height is an indication of how far off target the antenna is trained. How ever, these advantages are obtained at the expense of considerable complexity and a loss in the maximum range of the radar when the antenna is kept on target.
F. DETERMINATION OF ALTITUDE
1. Vertical Antenna Pattern.
If the radar antenna can be elevated sufficiently that none of the radiated energy strikes the surface of the water, the pattern of the radiation in a vertical plane will be a smooth lobe, similar to that shown in figure 9. However, if some of the radiated energy strikes the sea, the radiation pattern is considerably modified. This modification results from interference between the energy that is radiated directly toward the target and energy that reaches the target after reflection from the water. The effect of this interference is to break up the single lobe into a number of smaller lobes separated by areas called nulls, in which no echoes can be obtained. A three-dimensional sketch of the area

Figure 10--Double lobe pattern.
--14--

Figure 11--Typical vertical coverage pattern produced by water reflection.
"illuminated" by pulses transmitted from an SK antenna is shown in figure 11.
2. Altitude Estimation from Fade Chart.
The positions of the lobes and nulls in an antenna pattern remain the same as long as the antenna height and the radar frequency are unchanged. Therefore, it is possible for a chart showing the positions of the lobes and nulls to be prepared as a means of aiding in the estimation of altitude of aircraft targets. To use such a chart, called a fade chart, the radar operator must notice the ranges at which the plane disappears in the null areas, and by applying these ranges to the chart, an estimate of altitude can be made. Since the positions of the nulls depend only on the geometry of the situation, the fade chart can be calculated, and in fact a circular calculating device has been made up which eliminates the need for plotting the chart. For most dependable results, however, the data should be determined experimentally by flying an aircraft at several constant altitudes and recording both the observed signal strengths and the ranges.
Altitude can also be estimated by noting the range at which the echo is first detected. At least the bottom of the lowest lobe must be plotted to make such a method practical. This curve should be derived from actual measurements to reduce possible errors. However, this method is not very reliable, even with an experimentally obtained curve because too many variables beyond the control of the operator affect the range at which a target is first detected.
3. Measurement of Position Angle.
If the antenna beam can be elevated, the position angle of an aircraft can be determined by the same processes that are used to measure bearing, as long as the antenna is so designed that none of the radiated energy strikes the sea. Usually the position angle is measured by an antenna in which some form of double lobing or beam scanning is used. Special indicators are often used with radars capable of height finding in order to facilitate the determination of altitude from the measurement of position angle. The range measured by the radar on an aircraft is called the slant range (fig. 12). When both the position angle and the slant range are determined, the altitude of the plane can be found by solving the triangle RT A in figure 12 by calculation, by reference to a graph, or by a simple computer that is built into some radars. Altitude found in this way is not the true height of the airplane above the earth because the calculation is based on the assumption that the earth is flat. Thus in figure 12, it is assumed that the surface of the earth is the plane RA in which the ship seems to be sailing. As a result, the indicated altitude is TA. Because of the curvature of the earth, the actual altitude of the aircraft is TB rather than TA. At a range of 50 miles, the difference in these two altitudes may be as much as 1,500 feet.
--15--

Figure 12--Determination of altitude from position angle.
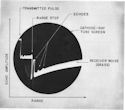
Figure 13--Type A presentation with range step (Type M scan).
--16--
G. TYPES OF DATA PRESENTATION
1. General.
The data obtained by radar is almost always displayed on the screen of a cathode-ray tube in order to enable the operator to interpret the received echoes. In some cases meters may be used to show some particular quantity, but meters have the disadvantage of reacting rather slowly to variations in the echo signal and there is no direct indication of when the meter is influenced by signals returned from more than one target. Thus, the utility of a meter as a radar indicator is rather severely limited. Cathode-ray tubes, on the other hand, are well able to display simultaneously the echoes from many targets and the inertia in this device is so small that variations that occur in less than a millionth of a second can be readily displayed.
There are two general methods of display in use with cathode-ray tubes at present. In one, the echo shows as a deflection, or pip, in a bright line. The position of this pip along the line is an indication of the range of the target. In the other general type of indicator the echoes show as bright spots on an otherwise dark screen. These two types of indicators are termed deflection and intensity modulated, respectively.
2. Deflection Presentations.
The most common kind of deflection indicator is the type A scope, shown in figure 13. The time base is produced by a linear rise in voltage which causes horizontal deflection of the spot across the cathode-

Figure M--Type R presentation provided in modernized SG.
--17--
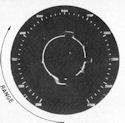
Figure 15--Type J presentation.
ray tube screen. The echo signal output of the receiver causes vertical deflection of the trace. A calibrated scale may be placed over the screen to permit reading range directly because there is a linear relationship between the sweep and time. In many radar sets, however, a marker produced electronically makes a sharp break in the time base as in figure 13. By aligning this marker with the echo signal, or pip, the range of the target can be read directly from range counters geared to the knob which controls the position of the marker along the trace.
In many types of equipment it is also possible to select a small sector of the time base near the range marker and to expand this part of the trace to the full width of the screen. Usually the length of this expanded sweep, which is also called a type R scope or a precision sweep, is 2,000 to 5,000 yards. The R scope shown in figure 14 is the one provided in the modernization of the SG radar. In this case the expansion takes place from the range to which the step is set. The step always appears at the extreme left
of the screen, and the trace is approximately 5,000 yards long across the full width of the screen. Notice that on this type of presentation the echo is spread out so that its character can be observed more easily than on the normal sweep. The expanded type of presentation is advantageous not only because range can be read with greater precision than on the full sweep, but also because range resolution is improved and the reading of IFF responses is facilitated.
In a few indicators a circular time base is used because the trace can be made almost three times the length of the straight trace on a given cathode-ray tube. An indicator in which a circular time base is used is called a Type J scope (fig. 15A). The echoes on this type of scan appear as radial deflections, and range is measured around the circumference of the circle. In the Mark 26 scope, illustrated in figure 15, zero range is at 6 o'clock.
Another type of indication shows only a single selected echo as a bright spot on a screen over which crosshairs are placed (fig. 16). This type of presentation is similar to that of a telescope. The antenna beam is kept on target by the pointer holding the spot on the horizontal line and the trainer holding the spot on the vertical line. When the target is lost, the solid bright dot opens into a circle, as shown in figure 16C This type of indicator is used on some antiaircraft fire control radars.
3. Intensity-Modulated Presentations.
In order to present both range and bearing data on the same screen, echo signals are made to appear as bright spots. By this means, the position of the bright spot in one dimension indicates range, while the position in the other dimension indicates bearing. When no echo signals are applied to an indicator of this sort, the screen is dark.
The type B presentation shows range vertically versus bearing horizontally (fig. 17). The bearing indicated by the vertical center line on the screen corresponds to the optical axis of the antenna and the

Figure 16--Moving spot indicator.
--18--

Figure 17--Type B presentation.
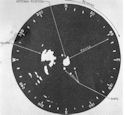
Figure 18--Type PPI presentation.
--19--
director on which the antenna is mounted. Bearing lines are provided to aid the operator in obtaining the bearing of the target. To produce an indication of this type, the antenna beam must be swept through a limited angle at a fairly high speed. Although this type of scanning is analogous to the scanning of a television iconoscope, radar is not yet sufficiently developed to permit a type B scan to indicate the silhouette of a target.
The type PPI presentation shows, in polar coordinates, a radar map of the area being covered, with the antenna occupying the center of the screen (fig. 18). The sweep moves radially outward from the center of the screen, and echoes appear as bright spots along this radial sweep. The sweep position is controlled by and synchronized with the antenna position throughout 360° rotation. For example, if the antenna is pointing 000° true, the sweep trace moves from the center
of the screen to the top. Either true or relative bearings of targets may be read directly from the calibrated scale around the screen, depending on whether or not the gyrocompass is connected in the system. Range is indicated by the radial distance from the center of the screen at which the echo appears. Thus range may be estimated from a series of concentric circles that may be put on a transparent overlay or produced electronically on the screen. Range may be measured by the use of a range marker which appears on the screen as a circle called a range ring, whose diameter is controlled by the range knob.
Other types of indicators have been developed and are in use. The types discussed here are fundamental, and other kinds of presentation that may be encountered will probably be related basically, but improved to present the data in a more useful way.
--20--
Table of Contents
Previous Chapter (1) **
Next Chapter (3)


