title graphic

2000. THE NAVIGATIONAL PLOT.

  1. BASIC CONSIDERATIONS.

    1. Definitions.

      1. The navigational plot shows by means of lines drawn on a plotting surface the successive positions of a ship's travel. Lines connecting these positions indicate direction and distance traveled with respect to the earth. This plot will, therefore, show the movement as would be observed from an airplane. (See Figure 1). This method of plotting is extremely valuable in the Combat Information Center in that it shows what is taking place with respect to the earth as well as with respect to ships in the area. It show? (as accurately as the data producing it will allow) what has already taken place and indicates trends upon which to plan future action.

      2. Direction of travel is referred to as "course" and is expressed in degrees or by points of the compass. The navy always uses the former and expresses the courses by three digit numerals, i.e., 000°, 002°, 270°, etc.

      3. Rate of travel is referred to as "speed" and is always expressed in knots. (1 knot = 1 nautical mile per hour).

      4. Distance is expressed in nautical miles. (1 nautical mile = 2000 yards). In arithmetic we have learned that rate times time equals distance. So if we travel at a rate of 15 knots for one hour we will have gone 15 nautical miles.

      5. Range is the distance between two objects, usually from the ship to an object, and is expressed in yards or miles.

      6. Bearing is the direction of one point or object with respect to another or to the points of the compass.

      7. True bearing is the direction of a point or object with respect to the direction of true North. It is measured 360° clockwise from 000° (North).

      8. Relative Bearing is the direction of one point or object with respect to the ship's bow. It is measured in degrees (or points) clockwise through 360°, 000° being the bow of the ship. (Note Figure 2)

      9. True bearings are used to facilitate the positioning of an object or ship with respect to the earth (or ship if its heading is known.) These bearings are readily plotted knowing only one position at which the bearings are taken.

      10. Relative bearings are used to locate objects with respect to the bow of a ship. To plot relative bearings it is necessary to know in addition to the point at which the bearing is taken, the heading of the ship at the time (unless automatically indicated).

      11. Thus, it is seen that true bearings are more useful to plotters than are relative bearings. On the other hand, relative bearings are more useful to lookouts and gunners who do not have access to a gyro repeater to determine the ship's heading.
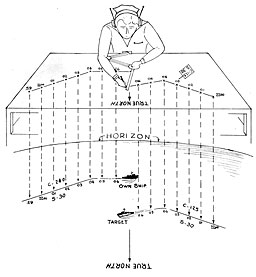
--2--


Figure 1
Figure 1

--3--


Figure 2
Figure 2

  1. Navigation As It Applies to Surface Plotting.

    1. Though we are dealing with the subject of surface plotting and more particularly the navigational phase, we must necessarily touch briefly upon some of the information covered in the broad subject of navigation. Certain principles must be used, and for that reason we are discussing this subject.

    2. "That science, generally termed navigation, which affords the knowledge necessary to conduct a ship from point to point upon the earth, enabling the mariner to determine with a sufficient degree of accuracy the position of his vessel at any time, is properly divided into two branches: Navigation and Nautical Astronomy." Since Nautical Astronomy is of little aid to plotting it will not be discussed in this manual.

    3. "Navigation in its limited sense is that branch which treats of the determination of the position of the ship by reference to the earth,

--4--


      or to an object thereon. It comprises:

      1. PILOTING, in which the position is ascertained from visible objects upon the earth, or from soundings of the depth of the sea.

      2. DEAD RECKONING, in which the position at any moment is deduced from the direction and amount of a vessel's progress from a known point of departure."

    1. It is "navigation in its limited sense" that is emphasized. Some of the elements of dead reckoning are discussed in later paragraphs. However, before any plotting can be done it is necessary to know how to record and maintain in a plot the successive positions of the ship. Once we have determined how to maintain the track of the ship, we can then begin plotting.

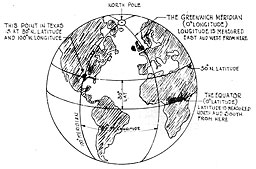
    2. Mention has been made of "the position of the ship by reference to the earth." To further clarify the picture, and before any attempt can be made at navigation, we must first have a method whereby we can locate or define a position at any point upon the earth (see Figure 3) . This is accomplished by means of imaginary lines running east and west known as parallels of latitude, and imaginary lines running north and south known as meridians (Lines of longitude) . A zero, or starting point, must be arrived at for each component. The equator is the natural latitude starting point as it divides the earth into two equal parts, so that any point on the equator is zero latitude. Proceeding north you pass 10° north latitude, 20° north latitude, and so on until you reach 90° north latitude which will be the north pole. Likewise, proceeding south from the equator the degrees of south latitude increase until you reach 90° south latitude which will be the south pole. Since there is no natural starting point for measurement of longitude, an arbitrary meridian passing through Greenwich, England was chosen. Any point on that half of the meridian which passes through both poles and Greenwich / is zero longitude. When traveling east of Greenwich, the longitude increases until 180° east longitude is reached. Likewise, when travelling west of Greenwich, the longitude increases until 180° west longitude is reached. 180° east or west longitude will be on the half of the meridian on the opposite side of the earth from Greenwich. By means of latitude and longitude, we can now position ourselves at any point on the surface of the earth merely by stating whether latitude is North or South, longitude is East or West, and how many degrees, minutes, and seconds each contains. Examples:

      Lat. 36°-59'-06" North; Long. 126°-32'-59" West.
      Lat. 30°-00'-00" North; Long. 100°-00'-00" West.
      (Illustrated in Figure 3)

--5--


Figure 3
Figure 3

  1. Dead Reckoning.

    1. Dead Reckoning is the phase of navigation with which the CIC plotter is most concerned. It is defined as "the process by which the position of a ship at any instant is found by applying to the last well-determined position the run that has since been made, using for the purpose the ship's course and the distance indicated by the log or other means."

    2. The course line is the direction prescribed fo the ship's movement or progress over the ground. This direction may be represented on a chart by drawing a straight line, called course line, which forms an angle with the meridians and equals the true course. In laying out the "course line" it is customary to start the line form the ship's last known or well-determined position. This line, then, represents the path the ship would follow (or would have followed), if there were no wind, if they were no currents, and if the ship could be steered exactly at every instant. Obviously, this is rarely, if ever, the case. Along this course line the plotter may plot dead reckoning (DR) positions for any given times by measuring off distances he should travel (or should have traveled) through the water since the time of the last known position. Distance may be determined form the pitometer log or indirectly from the propeller shaft speed.

--6--


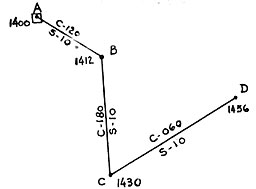
    1. To illustrate dead reckoning, investigate the following problem and apply the directions above.

    Given:

    1. Point A--Last well determined fix; 1400 position of own ship.

    2. Initial course of own ship--120° true.

    3. Speed of own ship--10 knots.

    4. At 1412 (Point B) own ship changes course to 180° true.

    5. At 1430 (Point C) own ship changes course to 060° true.

    Required: By dead reckoning find the position of own ship at 1456 (Point D) using a scale of 1 inch = 2½ miles.

    DR example Dist A-B = 2 mi. = dist. traveled in 12 min. at 10 knots.
    Dist B-C = 3 mi. = dist. traveled in 18 mm. at 10 knots.

    Dist C-D = 4 mi. = dist. traveled in 24 min. at 10 knots.


  1. Instruments and Accessories. (See Fig. 4 and 5)

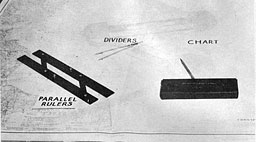
    1. Dividers or Compasses are used to transfer distances and to scribe arcs and circles.

    2. Parallel rulers are used to transfer a line parallel to itself.

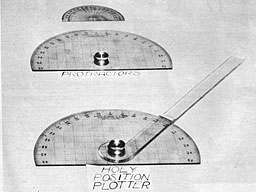
    3. The Protractor is used for laying down angular measures upon a chart or other plane surface.

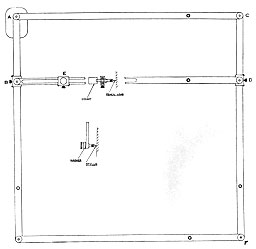
    4. Hoey Position Plotters. (See Figure 5) . The Hoey Position Plotter is used for plotting positions. The arm may be clamped at any angular position on the protractor and both bearing and range may be plotted from a given point, thus locating position.

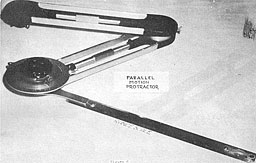
    5. The Parallel Motion Protractor (Universal Drafting Machine) (See Figure 6) is a protractor carried by a parallel motion linkage which is fastened to the upper edge of the chart board. The linkage permits the movement of the protractor to any part of the chart without loss of orientation. Therefore, the instrument affords a great convenience in laying off a course or bearing from any chosen point and in the parallel transfer of a straight line to any required position. The graduated protractor rim or compass rose can be clamped as desired, and hence oriented to coincide with the North and South direction of the chart.

--7--


Figure 4. Parallel Rulers and Dividers
Figure 4

Figure 5. Protractors and Holy Position Plotter
Figure 5

--8--


Parallel motion protractor
Figure 6

    1. Scales for the Parallel Motion Protractor are being provided by the Bureau of Ships' Allowance List General Amendment Number 215, (See Figure 7) . These scales are designed for determining speeds from whole minute time intervals with the exception of 1½ minutes on the 500 and 2000 yard scales and 2½ minutes on the 1000 yard scale. The speed scales are conveniently arranged on the range scale so as to facilitate speed determination. If the scales are to be used with odd quarter minutes of plot, estimation of whole minutes of plot will be necessary.

Figure 7. Parallel motion protractor scales
Figure 7

--9--


    1. Pantograph (Mk 1 Mod 0) (See Figures 8 and 9)

      A pantograph is being supplied to all CICs for reducing or enlarging charts or photographs.

      To set the instrument for any given enlargement or reduction, dividers should be used to insure that the distances AB, CD and BE are all equal (See Fig. 9.)

      To determine the divider setting in inches, the following formula is used:

        * (26/Reduction Ratio) = Divider setting.

      For example, if it is desired to obtain a reduction ratio of 3.5 to 1 the formula is:

        (26/3.5) = 7.43

      The divider setting is 7.43 inches and the pantograph should be set so that AB, CD, and BE all equal 7.43 inches. The pantograph is now adjusted for reduction (or enlargement) of 3.5 to 1.

      For reduction, the pencil lead must be placed at E, and the stylus must be placed at F. For enlargement the opposite is true.

2200. THE DEAD RECKONING EQUIPMENT.

  1. Explanation.

    The dead reckoning equipment consists of the Dead Reckoning Analyzer and the Dead Reckoning Tracer.

    1. DRA--Own ship's movement is put, into the dead reckoning analyzer in two components; ship's course from the gyro compass and ship's speed from the pitometer log.

      1. The gyro compass is a mechanical compass that receives its directive force from gyroscopic action.

      2. The pitometer log is a navigating instrument which indicates speed of a ship through water and registers the distance traveled.

      Information thus obtained is indicated on counters to show total distance traveled, distance made good to the East or West, and distance made good to the North or South.


* When the pantograph is to form a 20" square, substitute 20 for 26 in the above formula.

--10--


Figure 8. Pantograph
Figure 8

--11--


Figure 9. Pantograph line drawing
Figure 9

--12--


    1. DRT--In the dead reckoning tracer the distance components from the analyzer actuate motors which drive the "bug" (pencil carriage) which gives a geographical plot of the ship's travel, and the dials which indicate latitude and longitude. The latitude-longitude dials must be set in accordance with actual latitude and longitude at a given time. The energy fed through the analyzer will give continuous readings thereafter. As first designed the DRT was used to provide a graphic record of own ship's track for navigational purposes. The "bug, " with its projected spot indicating own ship's position at any time, and the plotting surface (the glass top) are modifications which provide plotting facilities for use in CIC. The "bug, " driven by the tracer, moves under the plotting surface in direction and distance representing own ship's movements to scale. Own ship's track is recorded by manually making successive pencil dots on the plotting surface to indicate the position of the ship at the time the dots are made.

  1. Pencil Carriage.

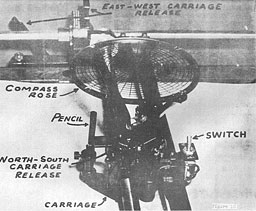
    The pencil carriage, or "bug, " is composed of the following: (See Figure 10)

    1. The compass rose, with range circles and bearing degree markings on the outer circle

    2. The pencil clamp

    3. The solenoid contact bar: Sliding contacts keep the pencil magnet electrically connected to the contact bar.

    4. The light bulb under compass rose.

    5. The light switch (should remain on "light" position for use in CIC.)

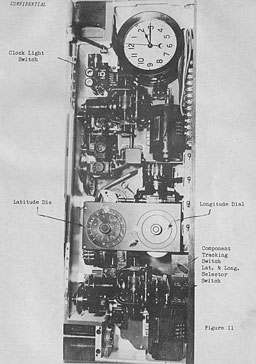
  1. Latitude and Longitude Dials. (See Figure 11)

    (a) Since a degree of latitude very nearly equals sixty miles anywhere on the earth's surface, the latitude dials are geared directly to the latitude motor. A selector switch is provided for changing the direction of rotation of latitude dials when the equator is crossed.

    (b) Since the number of miles East-West per degree of longitude varies with the latitude, a variable speed mechanism is introduced between the longitude motor and the longitude dials. The selector switch also changes the direction of rotation of the longitude dials when crossing the 0° or 180° meridian.

  1. Latitude and Longitude Selector Switch. (See Figure 11)

    This is the switch referred to above. It must be set according to the earth's quadrant in which the ship is operating.

  1. Component Tracking Switch. (See Figure 11)

--13--


Figure 10. Pencil carriage (bug)
Figure 10

--14--


Figure 11. Latitude & Longitude Dials
Figure 11

--15--


    This is provided to shift the plotting axis to accommodate the various positions in which the DRT might be installed aboard ship. Two choices are provided with directions as indicated:

    Plotting axes

  1. Clocklight Switch. (See Figure 11)

    Imposition 1 (LIGHT) the light will stay on continuously. In position 2 (OFF) the light is off. In position 3 (CLOCK) , which is seldom used in CIC, the light is on only 15 seconds of each minute.

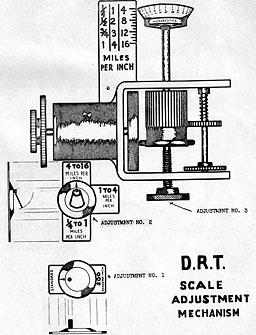
  1. Scales and Adjustments. (See Figure 12)

    1. The number one adjustment of the DRT scale mechanism is for either 200 yards per inch or standard setting. If set on 200 yards per inch, the tracer will move one inch for every 200 yards of ship's movement. Disregard all other scale dials for this setting.

    2. The standard scale ranging from 1/4 to 16 miles per inch is divided into three basic scales. (See adjustment number two Figure 12.)

        Green--1/4 to 1 mile per inch.

        White--1 to 4 miles per inch.

        Red--4 to 16 miles per inch.

      By lifting the locking pin on the setting knob, this knob is free to rotate the white line marker opposite to the basic scale desired To complete this adjustment it may be necessary to rotate the gear train to permit meshing of the gears. When one of the three basic scales has been determined, we can proceed to adjustment number three.

    3. Adjustment number three is a vernier dial equally divided as follows:

        Green--No division, simply a green zero.

        White--Zero to twenty five

        Red--Zero to one hundred by four's (i.e. 4, 8, 12, etc.)

      To move the vernier scale indicator one division on the miles per inch (green, white, or red) scale, requires one full turn of the vernier knob (adjustment number 3.) Therefore, to change scale from 1/4 to 1/2, 1 to 2, or 4 to 8 miles per inch requires four full, counter-clockwise turns of the vernier dial.

    1. Plotting Surfaces.

      A glass top is installed over the tracer for plotting. Plots, however, are not made directly upon the glass surface. There are two major ways of providing a suitable surface:

--16--


Figure 12. DRT Scale Adjustment Mechanism
Figure 12

--17--


    1. When using tracing paper a desirable arrangement is to have the roll of tracing paper held in place so that the paper can be unrolled across the glass top and fastened by scotch or masking tape. A single piece of tracing paper made fast to the glass top is another satisfactory arrangement.

    2. When transparent plastic is used have it slightly sanded to take pencil markings. To erase pencil markings, carbon tetrachloride is recommended.

    3. Both methods are now in use in the fleet. The tracing paper method will provide a record of the plot and will provide a neater plot.

2300 PLOTTING ON THE DRT.

  1. Positioning the "BUG".

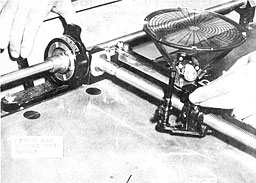
    The "BUG" on the DRT is moved to any position by releasing the clutch on the carriage (See Figure 13--right hand) and the clutch on the bug itself (See Figure 13--left hand) , and moving the bug transversely and longitudinally as desired.

Figure 13. Orienting pencil carriage
Figure 13

--18--


  1. Orienting the Parallel Motion Protractor to the DRT.

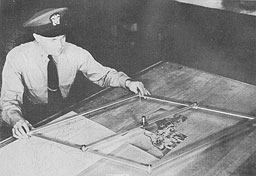
    The Parallel Motion Protractor is normally used in conjunction with the Dead Reckoning Tracer and must be oriented to the movement of the DRT bug. (See Figure 14) . Orientation can be accomplished by performing the following operations in sequence:

    1. Mark DRT bug position on the top plotting surface.

    2. Disengage the clutch and move DRT bug 10-12 inches in a 090 direction and plot new bug position.

    3. Position the protractor arm along the two plots and adjust the bearing indicator of the protractor so that a 090-270 true bearing line is indicated.

    4. If desired, orientation to the 000-180 line may be accomplished in a similar manner.

    5. A somewhat less accurate orientation can be effected by reference to the DRT bug compass rose.

Figure 14. Parallel mmotion protractor in use
Figure 14

--19--


  1. Developing Own Ship's Track on DRT.

    The DRT was originally designed as an aid to the Navigator. Using it in this capacity, a chart was placed beneath the pencil carriage on the plotting board, and the moving pencil automatically plotted own ship's track. For the DRT to be useful to CIC, it must be possible to plot bearings and ranges of surface targets, using standard plotting instruments, from the points along own ship's track at which the bearings and ranges were obtained. The recessed plotting board of the DRT is not suitable for this purpose. To provide a suitable plotting Surface for tracking targets, an auxiliary glass plotting table was added to the DRT. Also a compass rose or pin-point of light was added to the bug to show its position at all times. By plotting the movement of this pin-point of light the track of our own ship is developed.

  1. Indicating Time.

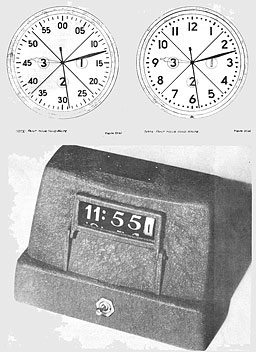
    On the first plot record the hour, minute, and quarter minute zone time, by a four digit number, with an exponent to indicate the quarter minute. For succeeding positions on the same "track" record time using only two digits and quarter-minute exponent until the next hour. Then record four digits to indicate the hour to which minute figures refer. In this manner the time will be amply recorded for evaluating purposes. The system of designating the quarter-minutes is as follows. To illustrate: the time indicated by the clock of Figure 15A and 15B is 122.

    Thus, if the second hand is within the 1st, 2nd or 3rd quadrant, an exponent 1, 2 or 3 respectively is written after the minute figure. If, however, the second hand is within the unnumbered quadrant, record only the nearest whole minute. The clock face of Figure 15B and 15C illustrate particular types of simplified clock faces designed for CIC plotting. For clarity it is desirable to "phantom" out the hour hand as in 15A and 15B.

  1. Plotting Bearings and Ranges using the Parallel Motion Protractor (PMP).

    Two methods are outlined:

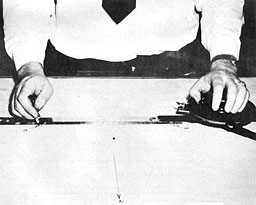
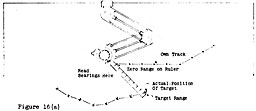
    1. Direct Plotting. (See Figure 16A).

      1. Plot position of own ship at time bearing and range is taken.

      2. With the range ruler free to rotate, set ruler at proper bearing (free hand uses ruler as a lever to set bearing).

      3. Place the bearing indication arrow that points toward the ruler on desired bearing; then lock the ruler.

      4. Place the zero mark of the ruler exactly on the desired marked position along own ship's track. The edge of the ruler now extends along the true bearing line from own ship's position.

      5. After hearing the range repeat it mentally while placing protractor in position. Now, read outward from zero to the desired range (in thousands of yards) and mark the point.

--20--


Figure 15. Clock faces
Figure 15

--21--


      1. Immediately after establishing this point, release lock on ruler leaving it ready for use.

      2. Move the PMP clear, of the plot so that the evaluator will have an unobstructed view of the plot and so that the plot may be "dressed up."

      Figure 16A. Direct Plotting
      Figure 16A. Direct Plotting

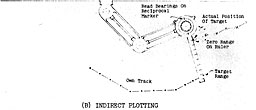
    1. Indirect Plotting. (See Figure 16B).

      Figure 16B. Indirect Plotting
      Figure 16B. Indirect Plotting

      Indirect plotting makes use of the reciprocal bearing mark to facilitate the plotting of targets which are awkward to handle by direct plotting. The following are variations from direct plotting

      1. The desired bearing is read beside the arrow which is 180° from the ruler side of the PMP arm.

      2. The desired range instead of the zero mark is placed at the marked position on own ship's track.

      3. The target's position is then plotted at the zero mark on the ruler.

--22--


    1. A combination of the above methods is used when plotting multiple targets. Awkwardness caused by turning the ruler through wide arcs can thus be eliminated in many cases.

  1. Symbols and Abbreviations.

    The following is the list of plotting symbols and abbreviations to be used:

    Symbol Meaning
    · Own ship
    X Unidentified or enemy contact
    O Friendly ship
    #3 Code number of IFF. (Figure placed beside Friendly Track at point of code identification
    ///// Under fire
    0 IFF only
    Radar fix Radar fix
    ( Right cut-on (Sonar)
    ) Left cut-on (Sonar)
    Cloud or rain squall Cloud or rain squall
    Designation of surface raids by letters Designation of surface raids by letters A,B,C, etc.
    500 yard circle around plot of ship dead in water 500 yard circle around plot of ship dead in water
    Off screen--target disappeared from radar screen Off screen--target disappeared from radar screen (may be amplified to show cause of disappearance). The target could then be dead reckoned along its most probable course using a dotted line to connect D.R. fixes.
    Jamming symbol Jamming symbol--placed along own ship's track at joint jammed. From this point an arrow will be drawn indicating center of sector jammed.
    Emergency IFF Emergency IFF
    Emergnecy IFF only Emergency IFF only
    Abbreviation Meaning
    L Large ship (prefaced by number)
    S Small ship (prefaced by number)
    LAT Latitude

--23--


    Abbreviation Meaning
    LONG Longitude
    C Course
    S Speed
    MS Make smoke
    CS Cease smoke
    DC Dropped charges
    FT Fired torpedoes
    OF Open fire
    CF Check fire or cease fire
    LO Look out report

  1. Data to be Recorded on Plots.

    In addition to the above the following must be indicated alongside the track to amplify and complete the picture:

    1. Alongside own ship's track indicate:

      1. Point of opening fire.

      2. Point of cease fire or check fire.

      3. Point of firing torpedoes and number fired.

      4. Base torpedo course and speed.

      5. Point of dropping depth charges.

      6. Other pertinent data such as smoke screen, lookout reports, received shellfire or torpedo hits, etc.

    2. Alongside target or enemy track indicate:

      1. The composition of the raid by number and types, or the best estimate available. Before number and types are established, the best information will generally approximate the number as one, few, or many and classify the types as Large or small. The composition of the raid is always boxed If the information is only in terms of one, few or many the box should be made large enough to permit the insertion of a subsequent estimate of the exact number and type in the box.

      2. Amplifying data such as "slowing," "on fire," etc. Record sources of information other than radar such as lookouts etc.

--24--


      1. Target designation letter circled at beginning of track. If a raid splits new designations are placed at the point of the split

      2. The code of IFF shown by a friendly contact is placed beside the track at the point where it is reported by the operator. The symbol should be of prominent size and is not enclosed in a box.

    1. The following additional data should be included where appropriate on the plot.

      1. Reference points, such as Point "Z", Point "0"', or geographical points.

      2. Wind force and direction.

      3. Arrow indicating true North. (place in such position as not to interfere with plot)

      4. Latitude and longitude of own ship.

      5. Scale of plot.

  1. Determining Course and Speed.

    1. Course.

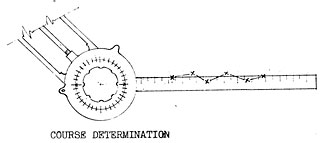
      The course of a series of plots is determined by laying the ruler of the Parallel Motion Protractor along the plots, gauging by eye the best positioning of the edge of the ruler. In estimating the best position for the ruler edge, through a series of staggered-plots, the higher degree of range accuracy and the lesser degree of bearing accuracy of the surface search radars must be taken into account. It will in general be found that the mean track line is the best estimate (see Figure 17). When the ruler is properly placed, the course is read from either the bearing mark or from the reciprocal bearing mark. Care must be used in selecting the mark that agrees with the direction in which the plots are developing. A simple protractor or a Hoey position plotter may be used to find the course if a series of North/South reference lines have previously been established on the plot.

Figure 17. Ruler places over mean track line
Figure 17

--25--


    1. Speed.

      1. Speed by Basic Formula: SPEED = (DISTANCE/TIME)

        Dividing the distance traveled in yards by the time in minutes, we obtain speed expressed in yards per minute, a figure that is of little use. To convert to knots we must first multiply by 60 minutes to get yards per hour, then divide by 2000 yards to get knots.

          EXAMPLE: The target has traveled 2200 yards in 2 minutes. Dividing 2200 by 2, we get a speed of 1100 yards per minute. Multiplying by 60, we change it to 66000 yards per hour. Dividing by 2000, we get a speed of 33 knots.

        There are various ways of performing this arithmetic mentally to obtain speed very quickly. The easiest method is applicable when we can measure exactly three minutes of the target's travel on the plot. In every such case we find that the distance covered in yards by the target in 3 minutes, less two zeroes, equals the speed of the target in knots.

          EXAMPLE: The target travels 1100 yards in 3 minutes. If we apply the formula, we find that the speed of the target is 11 knots, a figure we could have obtained from the 1100 yards by dropping two zeros. A target traveling 2900 yards in 3 minutes is making 29 knots. A target traveling 3350 yards in 3 minutes is making 33½ knots.

        We can make the same easy 3-minute rule apply to cases where we have only two minutes of travel, by first converting the actual travel in 2 minutes to a figure for three minutes.

          EXAMPLE: A target has traveled 800 yards in 2 minutes. This target would then travel 400 yards in the next minute, making 1200 yards in 3 minutes. Therefore its speed must be 12 knots.

          A target has traveled 1800 yards in 2 minutes. This target would travel 2700 yards in 3 minutes. Its speed must be 27 knots.

        By the same kind of mental arithmetic, we can stretch our 3-minute rule to cover a minute or a minute-and-a-half of travel.

          EXAMPLE: A target travels 800 yards on our plot in 1½ minutes. Therefore it would have traveled 1600 in a 3 minute period, and must be making 16 knots.

          A target has traveled 1100 yards in 1 minute. Therefore it would have covered 3300 yards in 3 minutes, and must be making 33 knots.

      2. By Mechanical Aids:

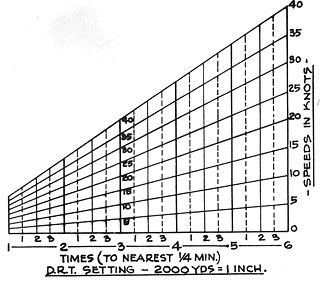
        1. The Speed-Time Nomogram (See Figure 18) is made up of a series of parallel lines on which are marked off the actual

--26--


        1. distances traveled by a ship at various speeds in different intervals of time. To use the nomogram to find the speed of a target on our plot, we pick from the plot the number of minutes of travel available, using a pair of dividers. Then we lay the setting on the dividers along the vertical line on the nomogram corresponding to the number of minutes of travel, matching the lower leg of the dividers to the base line of the nomogram. The upper leg then reads speed directly. It is apparent from this that the nomogram and the plot must be to the same yards per inch scale.

          Figure 18. Times (to neart 1/4 minute)--DR Setting
          Figure 18

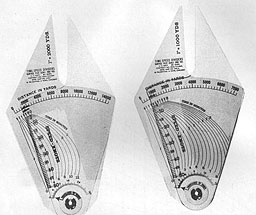
        2. The Time-Speed Dividers (see Figure 19)

          Place the points of the legs of the dividers on either end of a line constructed by two or more plots. leave the dividers as they are now adjusted. To determine the speed of the plotted contact, follow the line representing the duration of the plot in minutes to the speed scale.

          Note that the scale used on the plot must correspond to the scale for which the dividers were constructed. Dividers are provided designed for use with the following scales: 1000 yds/1", 2000 yds/1", 10, 000 yds/1".

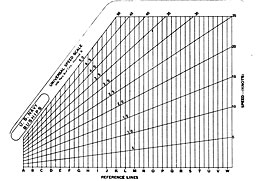
        3. Universal Speed Scales (See Figure 20): They compare corresponding portions of own ship's track and the track whose speed is to be determined. Any time interval for which both own ship's travel and other ship's travel are available is used. The length of own ship's travel is first picked off the plot with a pair of dividers and the setting moved along the Universal Speed Scale

--27--


Figure 19. Time-Speed Dividers
Figure 19

          with one leg always on the base line, until the upper leg just matches the speed line corresponding to own ship's speed. The letter of the vertical line along which the dividers now lay is noted. Then the length of other ship's travel for the same interval is picked off the plot and brought to the same lettered vertical line on the scales, matching the lower leg of the dividers to the base line. The speed of other ship is then indicated directly by the position of the upper leg of the dividers.

  1. Sample Plots.

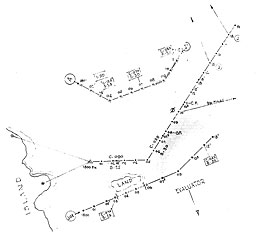
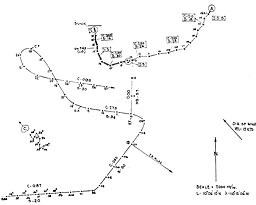
    The two sample plots (Figure 21 and Figure 22) portray the use of certain symbols and abbreviations set forth in this manual.

    Particularly notice the following:

    1. In plotting tracks a space is left between the symbol and course line rather than making a solid track. This produces a neater plot and one that is easier to read.

    2. Courses and speeds are boxed and a straight line is drawn to the last position along the track from which the information was received or taken.

    3. The arrow indicating true North is long enough to be used in orienting your PMP.

--28--


Figure 20. Unversal Speed Scale
Figure 20

    1. In figure 21 the arrows opposite the jamming symbols indicate the center bearing of the sector of the jamming. They will be useful in obtaining a fix on the jammer.

    2. In figure 21 notice that "Joe" is dead reckoned along his course when he disappears behind land for several minutes.

    3. Observe use of symbols for cloud, radar fix, under fire, dead in the water, emergency IFF, and disappearance of a target from the screen.

    4. In figure 22 the torpedo track is dead-reckoned to cross the targets prospective track.

    5. In figure 22 compare the smoothness of own track to the wavy track of the target. This is the result of own ship's course being taken from the dead reckoning tracer while the target's track is being plotted. The weaving in his track is the result of radar error. In determining his course use a "mean line" through the plots.

    There is much information to learn from these sample plots. Study them. Make use of these symbols and abbreviations in your plotting. By so doing you will be presenting instantly understandable displays to your ship.

2400. READINESS AND PRECAUTIONS.

  1. State of Readiness of the DRT at Sea.

--29--


Figure 21. Sample Plot
Figure 21

--30--


Figure 22. Sample Plot
Figure 22

--31--


    1. Position of the bug: During condition watches, the North and East component motor switches are kept in the "off" position (except when checking the DRT). The bug, however, should be kept properly positioned during these periods so that tracking may begin immediately if a contact is made. The proper position for the bug is one that will allow:

      1. Considerable run in the direction own ship is steaming before reaching the limit of travel for the bug.

      2. Sufficient plotting area in all directions from the bug to plot a sonar contact, if ship is sonar equipped.

      3. The maximum plotting area possible, while satisfying (l) and (2) , in the direction of the expected contact.

    2. Scale setting: During condition watches, a ship with sonar equipment should keep its DRT set to a scale suitable for immediate tracking of a subsurface contact, for the initial seconds after such a contact are precious. A ship using the 200 yd/in. scale provided for this purpose should keep the standard scales set to 2000 yd/in., so that a quick switch from "200 yd/in." to "Standard" will enable tracking of a surface contact to commence immediately. Many ships have found that the 200 yd/in. scale is too large for sonar work-- the bug reaching the limit of its travel before tracking is fairly begun--and prefer 500 yd/in. for subsurface contacts. These ships should keep their DRT's set to 500 yd/in. during condition watches, and a quick change from the green to the white scales will bring them to 2000 yd/in. for surface tracking. Ships without sonar equipment should keep their DRT's set to 2000 yd/in., to begin tracking at any time.

  1. DRT Casualties.

    1. Always be prepared for a casualty to your DRT. Should this happen, immediately extend your present course line from your last DR position. For example, should your ship be on course 260° when your DRT fails, set this course on your Parallel Motion Protractor Arm and draw a line in this direction from the last fix on your ship's DR track. Dead reckon your ship along this line. To find the distance your ship travels each minute, use your ship's speed in the formula below. If your ship is making 18 knots it will travel 600 yards each minute.

      (Knots × 2000)/60 = (Knots × 100)/3 = (18 × 100)/3 = 600 yds/min.

      A mark is made on your course line each 600 yards to indicate position of your ship for each successive minute. Your plot on all contacts can be continued from this new dead-reckoned course.

      It is recommended that time not be placed beside the track until own ship should reach that point. In this manner the location of own ship will always be indicated. Further, it is suggested that yardage not be marked off over 8-10 minutes ahead as there is the possibility your ship will change speed or course.

--32--


      The reaction of your DRT to course changes of various degrees should be studied and noted so that they may be duplicated in case of casualty to DRT. This is not a difficult problem but does require regular practice and review.

    1. A casualty to the ship's gyro compass is as serious as a casualty to the DRT itself. When the gyro goes out, the travel of the bug becomes unpredictable. Should the casualty occur it will be necessary to dead reckon your own ship through successive course changes using true headings. In most cases the headings that are passed to CIC from the conning station will not be the true headings needed for dead-reckoning because a magnetic compass will be in use. They will be either magnetic headings or compass headings. If they are magnetic headings we need apply only variation to correct to true headings. This variation can be supplied from a chart of your area and should be known at all times in CIC. If CIC is receiving compass headings, they must be corrected for both variation and deviation. The latter correction may be obtained from a curve of deviations made for the magnetic compass in use.

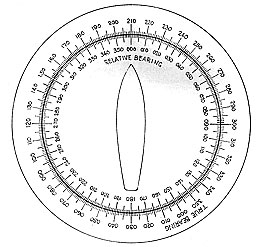
      As the deviation correction changes with each heading, a Curve of Deviations should be kept in CIC. This can be obtained from the Navigator. When the gyro becomes inoperative, the radar operator will begin reporting contacts in terms of relative bearings. We must convert them to true bearings to continue our true plot. A bearing converter makes this conversion a simple operation.

        Example: Should our own ship's heading be 210° when a relative bearing of 040° is reported, we find this to be a true bearing of 250° by referring to our bearing converter shown in fig. 23.

    2. It is suggested that casualty drills be held frequently. When traveling with other ships where your DRT might not be immediately required, turn out the light on your bug and dead reckon your ship. Turn on the light at intervals to check the accuracy of your dead reckoning. Drills simulating casualty to ship's gyro compass should also be held.

  1. Reminders

    1. Be neat.

    2. Be accurate.

    3. Write clearly.

    4. Use proper symbols.

    5. Connect plots with a solid line drawn not quite to each symbol.

    6. Use four digits with exponent at beginning of each track and two digits with exponent thereafter.

    7. Express time to nearest quarter minute.

    8. Show sufficient data on the plot to make it possible to transfer the tracks to a chart later. This will require that the scale of the plot be shown, that the direction of true north be indicated, and that the latitude and longitude of at least one point on the plot be shown. (Mark clearly final position of bug and record near it the readings of the latitude and longitude dials or, if time permits, obtain from the navigator the geographical position of the initial plot).

--33--


Figure 23. Bearing Converter
Figure 23

--34--


    1. Determine course and speed on first two or three minutes of track falling in any one general direction.

    2. Watch track for changes.

    3. Make information readable.

    4. Use reciprocal bearings to best advantage (indirect method when preferable).

    5. Keep parallel motion protractor clear of plot making the information thereon easily accessible to the evaluator.

    6. Keep left hand on bearing knob of parallel motion protractor when possible, free hand using ruler as a lever in setting bearings.

    7. After lining marker on parallel motion protractor at desired bearing, secure lock remembering to release it immediately upon establishing point. For experienced plotters it is recommended that the ruler not be locked but held to the desired bearing with the thumb.

    8. If evaluator is opposite the plotter, information should be written up-side-down only if plotter is proficient in doing this.

    9. Include all supplementary information on plot.

    10. Remember, the travel of your bug and the readings on your Latitude-Longitude Indicator represent your approximate or dead reckoned course or position. The effect of wind and currents and your helmsman's ability to steer exact courses is not taken into consideration.

    11. Check DRT for accuracy once each watch. The following reasonably accurate check on the DRT is readily obtainable at any time when under way. Set up DRT using a scale of 200 or 500 yards per inch. Check with the bridge for course and speed. Start DRT and run it for 8 or 10 minutes, carefully plotting in the course being followed by the bug. At the completion of the run compare the solution obtained by the DRT with the Dead Reckoning run made on the basis of true course and speed.

    12. Do not lean on DRT. Take good care of your equipment. Leaning on the top of the DRT will cause the top to sag. This sagging may be enough to cause the compass rose or top of light cover on pencil carriage to bind with the DRT top. This binding will cause the motion of the pencil carriage to be either retarded or stopped altogether. In either case the motion of the carriage will not represent what the ship is actually doing.

  1. Primary vs. Secondary Targets.

    The purpose for which any target is being tracked for course and speed must be kept in mind during the tracking, for it will govern the technique that is used in taking bearings and ranges.

    While with the present surface search radars, the antenna must be stopped on the target long enough to read each bearing and range if the target is a primary target (i.e., a target which for example is to be taken under fire) new developments will make unnecessary this undesirable practice.

    The S.G. Modernization Kit will provide a cursor and electronic range ring with which an accurate bearing and range can be ascertained from the PPI. Therefore, it will not be necessary to stop the sweep for tracking any targets. In addition to the S.G. Modernization Kits, the VF (Precision PPI) will provide an extremely accurate means of obtaining bearings and ranges without stopping the sweep. If the sweep is stopped for tracking, not only will all-around search be interfered with, but the distribution of the radar picture through Remote PPI's Projection PPI's, and Precision PPI's will be prevented.

--35--


    When the equipment is provided, all tracking should be done "on the fly" (without stopping the antenna). Even with present equipment, secondary targets should be tracked "on the fly"; courses and speeds can be obtained in this manner with sufficient accuracy to predict the tactical intentions of targets, and to insure their identification.

--36--

Table of Contents
Previous Part (1) Next Part (3)


Transcribed and formatted by Larry Jewell & Patrick Clancey, HyperWar Foundation