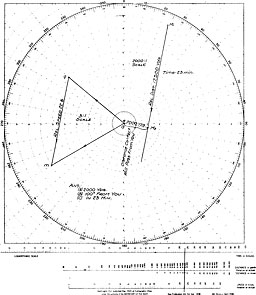
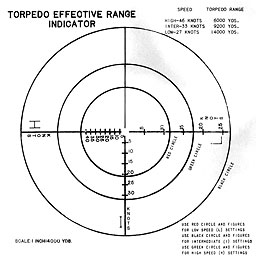
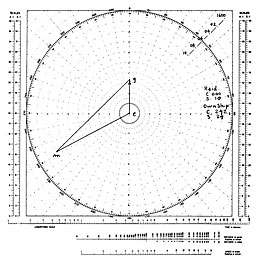
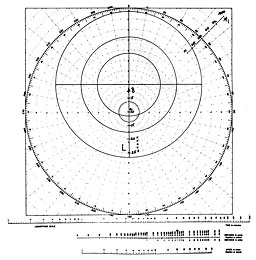
title graphic

3000. RELATIVE MOTION AND THE USE OF THE MANEUVERING BOARD.

  1. INTRODUCTION.

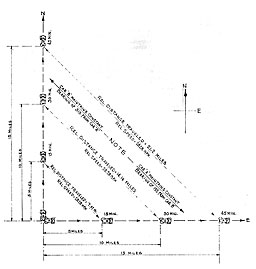
    Each of us is familiar with geographical movement. A man walking across the street moves geographically from a position on one side of the street to a position on the opposite side, passing through successive positions in the street while crossing. A motorist driving from one city to the next, along a winding highway or over a succession of roads and crossroads, makes the same kind of geographical movement--just a bit more complicated --as the man crossing the street. There is a second kind of movement that is as useful as geographical movement in many instances, particularly in CIC. It is the movement that takes place between two objects each making its own geographical movement. Consider the case of two motorists leaving the same point and driving North and East respectively, each performing a geographical movement of his own. If each drives at 20 miles per hour, he will travel 5 miles in the first 15 minutes. But after 15 minutes, the two motorists will be 7 miles apart, and the one who has driven East will be Southeast of the other motorist. This movement that has taken place between them--leaving the same spot and being 7 miles apart after 15 minutes--is different from the geographical movement of either motorist; it is the result of their geographical movements.

    If they follow their respective routes for another 15 minutes, each will have traveled 10 miles over the earth from the starting point. Yet at the end of this time the two will be separated by 14 miles, with the motorist who has gone East still directly Southeast of the one who has gone North. After the first 15 minutes the two were separated 7 miles in a SE/NW line; now they are 14 miles apart, still in a SE/NW line. If they drive for another 15 minutes, they will be separated about 21 miles, although each will have driven only 15 miles. It is apparent that each, insofar as the other is concerned, is moving 7 miles farther away every 15 minutes. He is accomplishing this separation in a definite direction. Let us place ourselves in the position of the motorist who has driven North. We see the motorist who has driven East getting farther and farther away from us, always to the Southeast of us, and getting 7 miles farther away to the Southeast every quarter hour. Aside from what either of us is doing with respect to the earth, it is apparent that there is a movement occurring between the other motorist and us: he is getting 28 miles farther Southeast of us every hour. In addition to the motion of the individual cars, one to the North, the other to the East, there is also a motion existing (See Figure 24) between the two. This motion is the RELATIVE MOTION between them.

  1. RELATIVE MOVEMENT.

    Relative motion or movement is concerned with the movement between two objects. Movement, in turn, is concerned with direction, distance, and speed. Since the movement under discussion here is relative, each of the above factors also become relative.
--37--


Figure 24. Chart of relative motions
Figure 24

--38--


Figure 25. Diagram of relative motions
Figure 25

    Suppose we wish to cross the street to join our friend Joe. What considerations must be weighed? Joe is moving on course BC and we wish to effect a meeting at C, so we will have to apply a "lead" in choosing a course. This is the same type of lead that a passer in football gives his receiver. We choose course AC, bringing us to point C at the same time Joe arrives there.

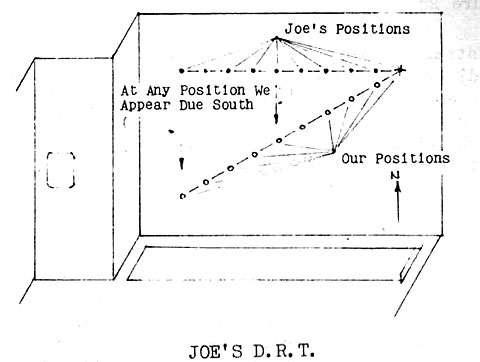
    This seems a simple Enough problem so let us examine the relative movement involved. Suppose this situation is happening on a dark night and we are carrying a flashlight. It will appear to Joe that we are continuously moving closer to him from the South as we move along our respective courses. He cannot determine our course as he sees nothing but a flashlight beam a little closer each time he looks. When we were at points A and B there was the distance AB between us. When Joe arrives at point E along his course, he will see a light in the street due south of him at point D. It will have moved North in relation to him since he last noticed it at point A. Since we are trying to close the distance AB, we now find, when we are seen at point D, we have shortened the distance AB by the amount AF. Not until we arrive will we have accomplished what we started out to do and closed the distance AB. Although we traveled course AC we appeared south of Joe each time he noted our flashlight. To him we appeared to be closing in a northerly direction until our meeting at point C. This statement might be reworded by saying that relative to Joe we moved North. North or 000° would then be our direction of relative movement. The distance AB would be the relative distance traveled or the distance we moved with respect to Joe.

    This same illustration, since we are already familiar with it, can again be used. Suppose Joe was carrying a PPI scope similar to the one on your radar. Examine the illustrations that follow to see how this relative movement would appear to him on this PPI scope.

--39--


Figure 26. PPI interpretation of the course convergence
Figure 26.

    Now let us see why this PPI scope picture is one of relative movement instead of a true movement. First, we will plot the actual movement on Joe's DRT. (See Figure 27).

    Figure 27. DRT Plot of actual movements
    Figure 27

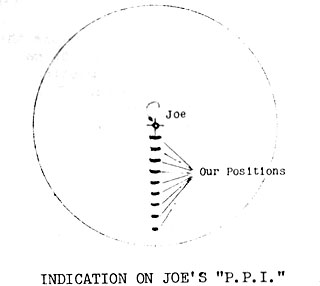
    Since Joe is always represented as one spot (the center) on this PPI scope, he has no track on it representing his own movement. His position then is always at the center. Do you remember how each successive position of our flashlight appeared to Joe to be moving North and toward him? We can see now that this motion is the same as is seen on his PPI scope. (See Figure 28.)

    Figure 28. Indication on Joe's PPI
    Figure 28

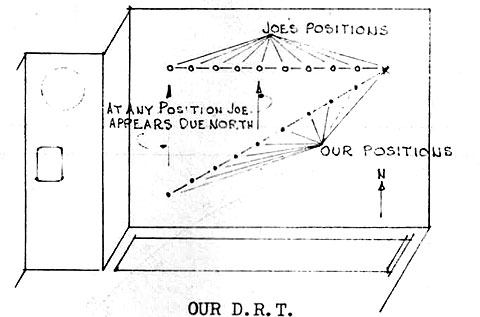
    Let us look further into this picture to see the presentation as viewed from our own PPI scope. The above examples were viewed from Joe's. There we studied our movement in relation to him; now we wish to study his movement relative to us. In the following illustration notice that our track will now be plotted with dots and Joe's with circles.

--40--


Figure 29. Plot on our DRT
Figure 28

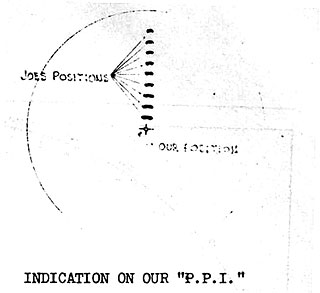
Figure 30. Indication on our PPI
Figure 28

    Whereas we appeared to be moving North in Joe's relative plot, (See Figure 28) he appears to be moving South in ours. (See Figure 30). We can draw a logical conclusion from this: If we are moving in the same area with Joe our movement as it appears to Joe is the reciprocal of Joe's movement to us. If we are moving on course 000° relative to Joe, we then know that Joe is moving on course 180° relative to us.

    The two pictures (Figures 28 and 30) showing our movement with respect to Joe and Joe's movement with respect to us have been developed by-placing successive PPI presentations one upon the other. These pictures are properly called plots because they show a series of positions or tracks. Since the tracks they show are lines of relative motion, they are RELATIVE PLOTS.

  1. THE MANEUVERING BOARD

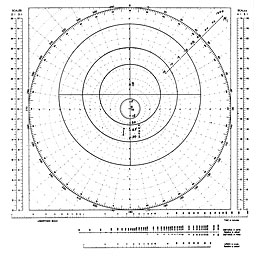
    Relative plots are used in CIC to aid in the solution of courses and speeds to accomplish certain maneuvers. Since these solutions are made frequently, while steaming at sea, there has been developed to speed this work, a standard plot form: The maneuvering board. Since a relative plot consists of successive positions plotted from a single point, the maneuvering board (HO 2665a) is equipped with bearing lines and range circles to facilitate this plotting.

    1. The Relative Plot on the Maneuvering Board.

      In solving any relative movement problem we must first decide which of the moving ships can best be held stationary on the relative plot. Then in placing our relative plot on the maneuvering board, we must put that ship at the center. This ship will be called the guide and will be labeled "Gn. (Do not confuse the guide in the maneuvering board problem with the fleet guide as they are not necessarily the same). The maneuvering ship will then be the ship whose movement we are considering. It will be at various bearings and ranges from the guide "G" at various times and will be labeled "M". Since it will be a moving ship the positions of "M" at successive times may be designated M1, M2, M3, etc. The line joining the successive positions are lines of relative movement of "M" with respect to "G". The following

--41--


Figure 31. Plot of relative speed
Figure 31

--42--


Figure 32. Plot of vector
Figure 32

--43--


      definitions involving these units best apply to our maneuvering board problems.

      1. Relative direction is the apparent direction the maneuvering ship moves in relation to the guide.

      2. Relative distance is distance the maneuvering ship moves with respect to the guide.

      3. Relative speed is the speed at which the maneuvering ship appears to move in relation to the guide.

      In the problem we are now to plot we will place our own ship in the position of the guide and label it "G". We will consider the movement of the other ship in relation to us. The bearings and ranges of the other ship from us are:

      Time       Bearing       Range
      1403   290   14000
      07   282   10800
      11   270   8000

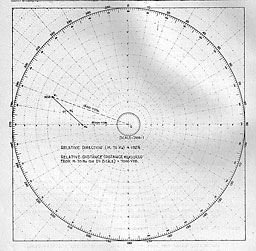
      What is the direction of relative movement and the distance the other ship travels in respect to us, i.e., relative direction and relative distance?

      To solve this problem on the maneuvering board we need a pair of dividers to measure distances and a pair of parallel rulers. Check the solution in Figure 31. It can be seen from this figure that the relative plot forms a triangle two sides of which are ranges and the third is relative distance.

    1. The Vector Diagram.

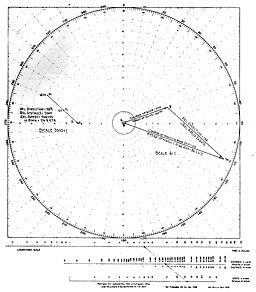
      The relative movement that occurred between "I'" and "G" in the preceding problem was the result of the courses and speeds of the two ships. "M" was on course 110° making 36.5 knots. "G" was on 070° making 16 knots.

      The direction and speed of each ship's movement can be represented by a single line the direction of which, corresponds to course and the length of which represents speed to some convenient scale. Such a graphic representation of direction of movement and speed is called a vector, such as "eg" shown in figure 32. A combination of vectors is called a vector diagram. It can be seen from figure 32 that the vector diagram like the relative plot is also a triangle. It should be noted that the two triangles, the relative plot and the vector diagram, are separate, distinct figures.

      Analyzing the three sides of each triangle we find in the:

      1. Relative Plot.

        1. G-M1--Initial bearing and range of maneuvering unit from guide.

--44--


        1. G-M2--Later bearing and range of maneuvering unit from guide.

        2. M1-M2--Relative direction and relative distance.

      1. Vector Diagram.

        1. eg--True course and speed of guide ship.

        2. em--True course and speed of maneuvering ship.

        3. gm--Relative direction and relative speed.

        It will be noted that "gm" and "M1-M2" are parallel and drawn in the same direction, as each represents the relative direction that the maneuvering unit travels.

    1. Scales.

      Ordinarily, the distance between circles on the maneuvering Doard will represent from 1000 to 5000 yards in the relative plot and 2 to 5 knots in the vector diagram. Scales for measuring these values are drawn on each side of the HO 2665a chart. Use them to prevent errors and speed up your work. Once a scale is chosen for one side of a triangle the same scale must be used for the other two sides. This does not say, however, that both triangles must be drawn to the same scale. It will be found convenient in most instances to choose one scale for the relative plot and another for the vector diagram (one represents distance and the other represents speed). A set of three logarithmic scales, called a nomogram, is provided below the plot on the maneuvering board to aid in the solution of time/speed/distance relationships. The three scales are so arranged that by marking off any two known values in the formula; DISTANCE = SPEED × TIME and laying a straight-edge through the points so marked, the correct value of the third quantity will be cut through the third scale. If, in the above formula, the distance that is known is a relative one, then the speed obtained will also be relative.

      RELATIVE-DISTANCE--RELATIVE SPEED × TIME

        EXAMPLE: Having a known time of 10 minutes and a relative distance of 10, 000 yards, we find the relative speed to be 30 knots. (See Figure 33).

Figure 33. Finding relative speed
Figure 33

--45--


    1. Illustrative Problems.

      1. The Course and Speed Problem.

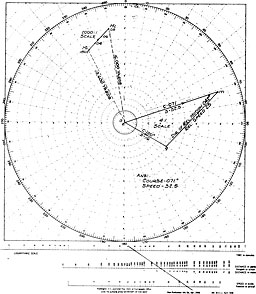
        If you have in mind the above definitions, you are ready to solve the following course and speed problem.

        1. Our ship is on course 120°, speed 16 knots.

        2. Radar gives us the following bearings and ranges on a surface contact:

          Time     Bearing     Range
          1802   333   13600
          04   339   14100
          06   345   15000
          08   350   16000

        3. Determine course and speed of contact.

        Check the solution in Figure 34.

      2. Determining How Close a Contact Will Pass.

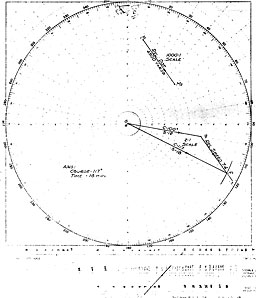
        Next, you are ready to determine how close a contact will pass to your ship provided neither ship changes course or speed.

        1. Your own ship is traveling on course 310°, speed 18 knots.

        2. A contact is tracked to be on course 240°, speed 21 knots.

        3. The present radar bearing and range on the contact is 024°, 18000 yards.

        4. Assuming neither ship changes course or speed:

          1. How close will contact pass to you?

          2. At what bearing?

          3. How long before he will be nearest you?

        Check the solution in Figure 35. Had the contact in Figure 35 been on such a course as to have brought him (M1-M2) through point "G", our two ships would, have been on collision courses. On a collision course the bearing would be the same each time we checked, with the range decreasing. To prevent a collision, it would, then, be necessary to change our course, speed or both in such a manner as to bring the relative movement line away from point "G". You can detect collision courses on your radar by noting each successive trace to be on an identical bearing from your ship at the center.

      3. The Change of Station Problem. (Same as Course, Speed and Time to Attack Position.)

        1. In the event you wish to change your position in relation to another ship you must- take into, account his course and speed. The amount of "lead" that will be necessary is dependent upon these two factors and on the amount of speed you will be able to use on this maneuver. Again the maneuvering board is used in deciding a course" to take. In this case we do not wish to determine the course and speed of a contact; we now wish to determine a course for our own ship to' travel. We will be represented as "M1" the maneuvering ship. The other ship, therefore, must be "G", the guide ship. "G" is always placed at the center of our chart so our ship is not at the center as in the previous two problems.

--46--


Figure 34. Solution to course and speed problem
Figure 34

--47--


Figure 35. Solution to course and speed problem
Figure 35

--48--


Figure 36. Solution to course and speed problem
Figure 36

--49--


        1. First, draw the relative plot. Let "M" represent your present bearing and range from "G". "M2" will be the desired position, or where the maneuvering ship is to go relative to the guide. By connecting these two points, the relative direction and relative distance are found. To travel from M1 to M2 we must find a true course to steer which takes into account the guide's movement.

        2. His movement, since he is at "G, " will be represented by vector "eg." The "pm" line may be drawn starting, of course, at "g" as it always parallels M^-Mo. Now, either the time allowed to complete the maneuver must be known (as in a course and speed problem) or the speed to be used by the maneuvering ship must be known. In the latter case the speed of "M" (maneuvering ship) is represented by the length of its vector "em". As yet we still do not know the direction of "em." Since "m" is known to be on "gm" in the direction from "g" of the relative movement, and since "m" is also a distance from "e" equivalent to the speed of "M", their intersection definitely locates point (m).

      1. The following is a solution of the change of station problem:

        1. The USS NORTH CAROLINA is on course 100°, speed 12 knots.

        2. She bears 190°, 7000 yards from us. (Use reciprocal bearings).

        3. We wish to move to a position where the NORTH CAROLINA will bear 230°, 5000 yards from us.

        4. What course will we steer if we use 18 knots?

        5. How long will the maneuver take?

          Check the solution in Figure 36.

      2. Finding Base Torpedo Course

        1. Plot a line from the point at which torpedoes are to be fired to the center of the maneuvering board (target). (By keeping a reciprocal plot of the target up to date, this line can be drawn at any instant it is decided to fire torpedoes.)

        2. Move this lone (parallel to itself) to the end of the line representing target course and speed. The BTC can then be read at the intersection of this line with the circle representing speed at which the torpedoes are to be fired.

      The most useful problems for your daily work in CIC have been presented. To develop your ability to think in terms of relative motion, study the movement on your PPI scope. Take every opportunity to work "live" problems as your ship changes station. It is necessary to work problems regularly for the principles of maneuvering board are rapidly forgotten.

--50--


    1. The Torpedo Effective Range Indicator and its Use.

      The TERI is used as an overlay on the maneuvering board during a torpedo approach to determine when you come within effective range for your torpedoes.

      1. Assumptions:

        1. That the torpedo speeds to be used are:

          1. High--45 knots.

          2. Intermediate--33.5 knots.

          3. Low--27 knots.

        2. That the effective range* of the torpedo varies with speed setting, or:

          1. High setting--6000.

          2. Intermediate setting--9200.

          3. Low setting--14000.

        3. That this particular scale of torpedo effective range indicator be used with the 10" maneuvering board (H.0.2665a) , using a distance scale of one (1) division equals one (1) mile which is one (1) inch equals 4000 yards.

      2. Description. (See Figure 37).

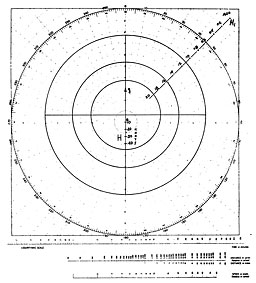
        On a piece of transparent plastic 8½ × 8½ × 0.1" three concentric circles are drawn. The largest circle has a radius that represents 14000 yards on a scale of one inch equals 4000 yards. This circle is red. The next largest circle has a radius that represents 9200 yards on the same scale as the large circle. This circle is black. The small circle has a radius equal to 6000 yards on the same scale and is colored green.

        Two diameters of the largest circle are inscribed 90 degrees apart. The circles so inscribed represent speed as well as range. Hence, three speed scales are placed on three of the four radii formed by the perpendicular diameters. The scale marked "L" representing low speed and 27 knots (the large circle) , is divided into five knot divisions. The scale marked "I" represents intermediate speed and divides the thirty-three and one half knots into five knot divisions. The scale marked "H", representing high speed and 45 knots, is divided into 5 knot divisions.

      3. Use.

        For example, let our ship be destroyer "M". At 1600 "M" came to course 242(T) , speed 24 knots, to close target "G" (course 000(T) speed 10) on a collision course in order to make a torpedo attack on "G". At 1600 "G" is bearing 225(T) range 2600 yards from "M". (See Figure 38).


*The effective range to be used may be changed to conform with doctrine.

--51--


Figure 37. Torpedo Effective Rrange Indicator
Figure 37

--52--


Figure 38. Solution
Figure 38

--53--


Figure 39. Solution
Figure 39

--54--


Figure 40. Solution
Figure 40

--55--


        Using the Torpedo Effective Range Indicator (TERI) determine the following:

        1. Earliest time fto nearest minute) that "M" can fire a long range torpedo spread at "G" using torpedo speed of 27 knots.

        2. Time to shift to intermediate speed setting (33.5 knots) on the torpedoes.

        3. If we elect to fire at 6000 yards bearing 045(T) from the target, can we use high torpedo speed and expect to hit the target?

      1. Solution.

        1. Determine the Relative speed of problem by solving vector diagram. (See Figure 38) ANS. 30 knots.

        2. Locate "G" at center of Maneuvering Board with "eg" indicating true course of "G" (See Figure 39).

        3. Locate M1 or 1600 position, and plot positions of "M" at any time interval (2 minute intervals were selected for purposes

          of this illustration).

        4. Place the TERI on the maneuvering board as shown in Figure 39. It is so placed that the 10 knot division on "L" scale ("G's" speed) coincides with the center of the board ("G's"1position relative to "M") and the diameter of the TERI extends along "G's" course vector. The center of the TERI is the point where the torpedo and "G"1 will meet if the torpedoes are fired at any point on the large circle with a speed setting of 27 knots.

        5. Notice that the large circle intersects our relative movement line at about the 1609 position. This is the position, "M" must have in the problem to fire torpedoes at "G" the earliest and expect to hit, if "G" does not maneuver after torpedoes are in the water.

        6. To determine the time at which to shift to intermediate speed setting, line up the TERI as shown in Figure 40. This is done exactly as is described in step 4 except use the "I" scale and the middle circle. Now the M1--M2 line (our relative movement line) is cut by the intermediate circle at about the 1615 position. This indicates the time that "M"' can fire torpedoes at "G" and expect to hit, if 33.5 knot torpedoes are used and "G" does not maneuver after the torpedoes are in the water. This is the earliest practicable time to shift speed settings from "low" to "intermediate."

        7. To determine if we can use high speed setting and expect to hit the target if we fire from 6000 yards bearing 045(T) from "G", line up the TERI as shown in Figure 41. Notice that our elected firing position is inside the small circle; therefore, we can fire using a torpedo speed of 45 knots and expect to hit "G", providing "G", does not maneuver after the torpedoes are water borne.

--56--


Figure 41. Solution
Figure 41

--57--


        1. We may determine the track angle of our torpedoes from any proposed firing point on the TERI. This may be read in degrees on either side of the bow on the respective range circles. Had we fired high speed torpedoes at time 1619 (as in Figure 41) , the approximate track angle would have been 45 degrees. Note we are using as a point of measure, the center of the TERI and not the center of the maneuvering board. In a similar manner any firing position may be determined in advance for a particular track angle. It is suggested that holes be drilled through the TERI as desirable track angles so that these positions may be indicated through the holes by a pencil mark directly on the maneuvering board. This will facilitate determining an approach course.

        2. If doctrine introduces a safety factor to be subtracted from effective range, the range circles on the TERI will need to be redrawn to conform to these new ranges. The solution set out above will still apply.

        3. Remember, the TERI is designed for use with our own and not enemy torpedoes. To determine if we are in effective range of the enemy's torpedoes, we would have to make another TERI fitting the characteristics of his torpedoes.

    1. Three Minute Thumb Rules for Determining Course and Speed.

      This thumb rule is designed to simplify the steps necessary for determination of a course and speed solution.

      The "egm" speed triangle as previously discussed is the basis for the rule and the following are set forth.

      1. Own ship's course and speed is represented by the "eg" vector.

      2. Stranger's for raid as designated) course and speed is represented by the "em" vector.

      3. Relative speed and Direction of relative speed of raid with respect to our ship is represented by the vector "gm".

      4. The line of relative movement received and plotted is a relative surface plot and is represented by M1-M2.

      5. Items 3 and 4 are parallel and in the same direction with each other.

      6. The scale for distance must be 1 DIVISION=1000 yards. (A DIVISION is equal to the space between two rings on a polar plot).

      7. The scale for speed must be 1 DIVISION = 10 knots.

      To compute any speed of travel the distance in yards divided by the time in minutes equals the speed in yards per minute. This speed for our three minute rule purposes must be converted into knots. For clearness this conversion is shown.

--58--


        1 knot = 1 nautical mile per hour

        1 knot = 2000 yards per hour

        1 knot = 2000 yards per 60 minutes

        1 knot = 100 yards per 3 minutes

      Prom the last statement in this breakdown the conversion can be made.

        Yards traveled per minute × .03 = speed in knots. 42

          Example:   42
          4209
            3
          ×  
            3 
          100
          = 42 knots

      Restating the above we arrive at the heart of the 3 minute thumb rule.

      For yards traveled in 3 minutes point off (or drop) two places from the right end of the number of yards traveled. The resultant will be speed in knots.

      Properly attach this resultant in knots, which is equal to vector "gm," to vector "eg," and vector "em," or the true course and speed, is solved.

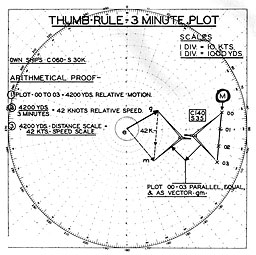
      An example can best prove the worth of the last statement and 3 minute thumb rule. As shown in Figure 42 at 00 time raid m is reported at bearing 080° range 8000 yards. Successive reports of bearing 090° range 7800 yards, bearing 101°, range 7700 yards, bearing 111° range 8000 yards, are made at times 01, 02, and 03 respectively. The plotting of these reports gives M's direction of relative speed. Since we have three minutes of plot we may apply our three minute rule. Measure the length of the plot from 00 minutes to 03 minutes. Transfer this length of line parallel to M's track and attach it to the end of the "eg" vector. The length of line now becomes the "gm" vector which determines the. length of "em" vector and therefore gives us the true course and speed of raid M.

      It is apparent from inspection of a maneuvering board that, by using 1 division equals 1000 yards, the maximum range at which a raid may be plotted is 10, 000 yards. In order to plot at greater ranges use the following scales:

      Scale to be used           Lengths of Line to be taken
      to equal "gm"
      1 Div = 2000 yards   length of 3 minutes of travel × 2
      1 Div = 3000 yards   length of 3 minutes of travel × 3

      1 Div = 4000 yards   length of 3 minutes of travel × 4

      The scale for speed must remain 1 DIV = 10 knots.

--59--


Figure 42. Thumb rule: 3-minute plot
Figure 42

--60--


    1. The Plastic Maneuvering Board.

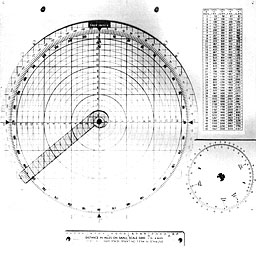
      The Plastic Maneuvering Board which is furnished CICs by the Bureau of Ships has been adopted for surface use from the Mk 3 Navigational Plotting Board.

      The board is a mechanical device for the solution of vector diagrams without the use of dividers, rulers and parallel rulers (or Universal Drafting Machines).

      The Mk. 8 computer attached to the lower right hand corner of the board, is a circular slide rule designed to assist in making speed-time-distance computations. This computer eliminates the necessity of using the straight-edge or dividers necessary for computations with the traditional logarithmic scale printed on the maneuvering board.

      The following is a description of the Plastic Maneuvering Board printed in the 1943 edition of Button's, Navigation and Nautical Astronomy.

      "The board is assembled with a transparent plotting surface over the grid disc. The Plotting surface is of plastic with a matte finish to make it a suitable writing surface and permitting lines to be erased. The compass rose and the north pointing arrow are inscribed on the under side of the plotting surface. The grid disc which rotates on a pivot under the plotting surface has printed on it, a rectangular grid and a series of concentric circles. A speed-distance scale is printed along the two diametric lines, which are the centerlines of the grid. At the ends of one of the diametric lines are printed "true index"1 markers which are the mid-points of variation scales. Since the grid disc may be rotated, the grid lines may be oriented in any desired direction by means of the compass rose inscribed on the plotting surface. The speed-distance scale permits the grid and the concentric circles to be used for measuring distance, eliminating the use of dividers. By rotating the grid disc the line may be oriented under the plotting surface so that a grid line is available as a guide for free hand drawing on the plotting surface of a line in any desired direction from any point on the plotting surface. This eliminates the necessity for the use of a ruler as a guide in line drawing, or the use of parallel rulers to obtain parallel motion."

--61--


Figure 43. Plastic Maneuvering Board
Figure 43

--62--

Table of Contents
Previous Part (2) Next Part (4)


Transcribed and formatted by Larry Jewell & Patrick Clancey, HyperWar Foundation